
Mathematics, 01.06.2021 19:10 amandasantiago2001
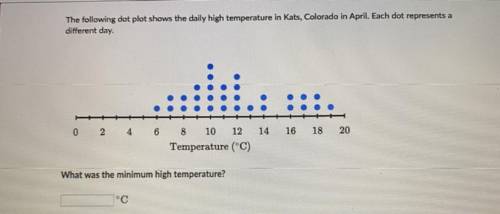
The following dot plot shows the daily high temperature in Kats, Colorado in April. Each dot represents a
different day.
0
2
4
6
14
16
18
20
8 10 12
Temperature (°C)
What was the minimum high temperature?

Answers: 1


Other questions on the subject: Mathematics
Mathematics, 21.06.2019 20:00, carligreen090
Leslie started last week with $1200 in her checking account. during the week, she wrote the checks below.
Answers: 1
You know the right answer?
The following dot plot shows the daily high temperature in Kats, Colorado in April. Each dot represe...
Questions in other subjects:

Mathematics, 15.06.2021 19:00
Mathematics, 15.06.2021 19:00

Business, 15.06.2021 19:00
Mathematics, 15.06.2021 19:00

Mathematics, 15.06.2021 19:00
Mathematics, 15.06.2021 19:00
Mathematics, 15.06.2021 19:00


