
Mathematics, 31.05.2021 22:40 katey6934
Mr. Jack conducted a survey among the students in his class to see what the most popular color was. The results of his survey are displayed in this table. Which statistic(s) can be used to represent the most popular color? A. the mean B. the median C. the mode D. the median and the mode

Answers: 2


Other questions on the subject: Mathematics
Mathematics, 21.06.2019 22:30, wednesdayA
Ineed big ! the cost of a school banquet is $25 plus $15 for each person attending. create a table, sketch the graph, and write an equation in slope-intercept and point-slope form that gives total cost as a function of the number of people attending. what is the cost for 77 people?
Answers: 1
Mathematics, 21.06.2019 22:30, qveensentha59
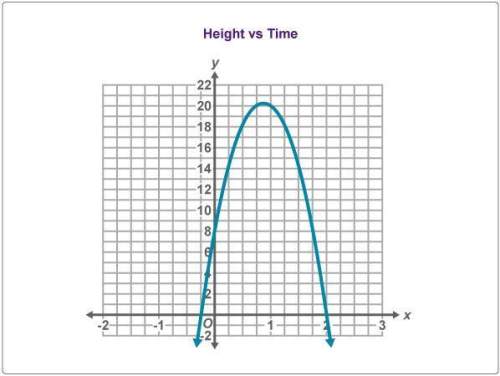
Which of the functions below could have created this graph?
Answers: 1
You know the right answer?
Mr. Jack conducted a survey among the students in his class to see what the most popular color was....
Questions in other subjects:

Chemistry, 09.07.2019 06:50

History, 09.07.2019 06:50
Mathematics, 09.07.2019 06:50

English, 09.07.2019 06:50
Mathematics, 09.07.2019 06:50
Mathematics, 09.07.2019 06:50
Mathematics, 09.07.2019 06:50

Advanced Placement (AP), 09.07.2019 06:50

Social Studies, 09.07.2019 06:50


