
Mathematics, 31.05.2021 21:50 vaizen9621
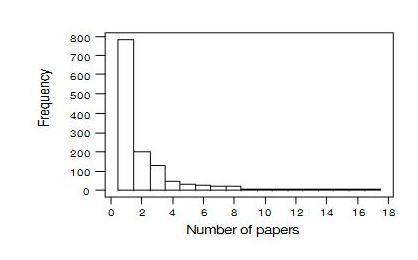
In a study of author productivity, a large number of authors were classified according to the number of articles they had published during a certain period. The results were presented in the accompanying frequency distribution:
Number of papers 1 2 3 4 5 6 7 8 9 10 11 12 13 14 15 16 17
Frequency 708 204 127 50 33 28 19 19 6 7 6 7 4 4 5 3 3
Required:
Construct a histogram corresponding to this frequency distribution.

Answers: 3


Other questions on the subject: Mathematics
You know the right answer?
In a study of author productivity, a large number of authors were classified according to the number...
Questions in other subjects:

Health, 13.07.2019 02:00

Mathematics, 13.07.2019 02:00

History, 13.07.2019 02:00
Mathematics, 13.07.2019 02:00
Mathematics, 13.07.2019 02:00


