
Mathematics, 31.05.2021 14:00 kob3965
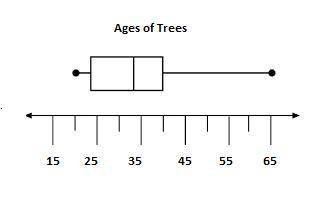
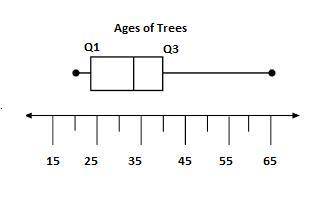
He box-and-whisker plot below shows the distribution of the ages, in years, of the trees in the Gordons' back yard. The title of the box and whisker plot is, Ages of Trees. The number line is labeled, age, in years, and ranges from 15 to 65. Based on the data shown in the box-and-whisker plot above, what is the interquartile range of the ages, in years, of the trees? Respond in the space provided. If your test is on paper, write your answer on the answer she

Answers: 1


Other questions on the subject: Mathematics
Mathematics, 21.06.2019 18:00, angeladominguezgarci
Which ordered pair is a solution to the system of linear equations? 2x + 3y= 6 –3x + 5y = 10
Answers: 1
Mathematics, 21.06.2019 22:30, abigail251
The given diagram shows the parts of a right triangle with an altitude to the hypotenuse. using the two given measures, find the other four.
Answers: 1
Mathematics, 22.06.2019 00:00, victorialeona81
Find the root(s) of f (x) = (x- 6)2(x + 2)2.
Answers: 1
Mathematics, 22.06.2019 00:00, nataliajaquez02
Jessie and bob are financing $425,500 to purchase a house. they obtained a 30/8 balloon mortgage at 6.55%. what will their balloon payment be?
Answers: 3
You know the right answer?
He box-and-whisker plot below shows the distribution of the ages, in years, of the trees in the Gord...
Questions in other subjects:

Chemistry, 07.09.2020 19:01

English, 07.09.2020 19:01

Mathematics, 07.09.2020 19:01
Mathematics, 07.09.2020 19:01
History, 07.09.2020 19:01
Mathematics, 07.09.2020 20:01


