PLEASE ANSWER ASAP
1. What type of correlation does the graph show?
2. What is the strength o...

Mathematics, 30.05.2021 23:10 xojade
PLEASE ANSWER ASAP
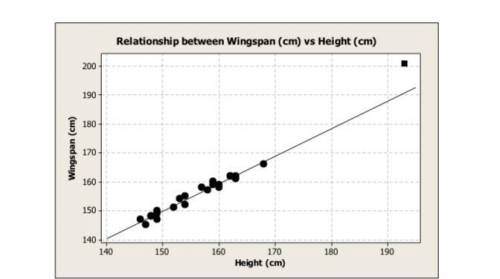
1. What type of correlation does the graph show?
2. What is the strength of the correlation?
3. Is there a cluster or outliers, if so describe where they are located.
4. Draw the best fit line. What is the equation of the best fit line?

Answers: 3


Other questions on the subject: Mathematics
Mathematics, 21.06.2019 13:30, aliami0306oyaj0n
Suppose a triangle has two sides of length 32 and 35, and that the angle between these two sides is 120°. which equation should you solve to find the length of the third side of the triangle?
Answers: 1
Mathematics, 21.06.2019 23:40, averycipher
Which point-slope form equation represents a line that passes through (3,-2) with a slope of -4/5
Answers: 1
You know the right answer?
Questions in other subjects:

Biology, 24.09.2019 09:30
Biology, 24.09.2019 09:30


Chemistry, 24.09.2019 09:30

Mathematics, 24.09.2019 09:30


