
Mathematics, 30.05.2021 19:30 elizabethwaller8104
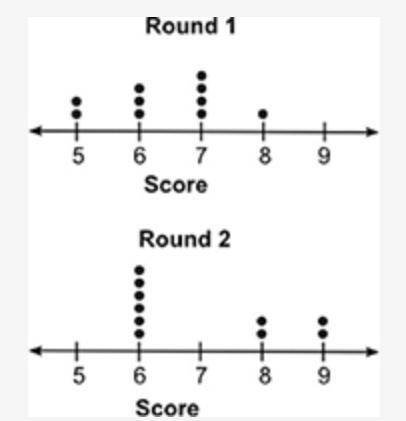
The dot plots below show the scores for a group of students who took two rounds of a quiz: Two dot plots are shown one below the other. The title for the dot plot on the top is Round 1 and the title for the bottom plot is Round 2. Below the line for each dot plot is written Score. There are markings from 5 to 9 on the line at intervals of one. There are 2 dots above the mark 5, 3 dots above the mark 6, 4 dots above the mark 7, and 1 dot above the mark 8. For the bottom dot plot there are 6 dots above the mark 6, 2 dots above the mark 8, and 2 dots above the mark 9. Which of the following inferences can be made using the dot plot? The range of each round is the same. There is no overlap between the data. Round 1 scores were higher than round 2 scores. Round 2 scores were lower than round 1 scores.

Answers: 1


Other questions on the subject: Mathematics
Mathematics, 21.06.2019 20:20, maxi12312345
Aline passes through (1,-5) and(-3,7) write an equation for the line in point slope form rewrite the equation in slope intercept form
Answers: 1
Mathematics, 22.06.2019 00:50, sharonsmailbagot6uas
After reading 80% of her e-mails in her inbox, danette still has m unread e-mails. which of the following expressions could represent the number of e-mails danette had in her inbox before she started reading? choose 2 answers: (choice a) 5m (choice b) 1.8m (choice c) 80m (choice d) m/0.8 (choice e) m/1−0.8
Answers: 1
Mathematics, 22.06.2019 01:10, onlymyworld27
To find the inverse of a number a, one can use the equation f(c) = a-1/c=0 where c is the inverse of a use the secant method of finding roots of equations to find the inverse of a = 2.5 ,er = 0.001%
Answers: 3
You know the right answer?
The dot plots below show the scores for a group of students who took two rounds of a quiz: Two dot p...
Questions in other subjects:


History, 04.06.2020 19:57
Mathematics, 04.06.2020 19:57

Mathematics, 04.06.2020 19:57
Mathematics, 04.06.2020 19:57


