
Mathematics, 29.05.2021 01:20 o11011195
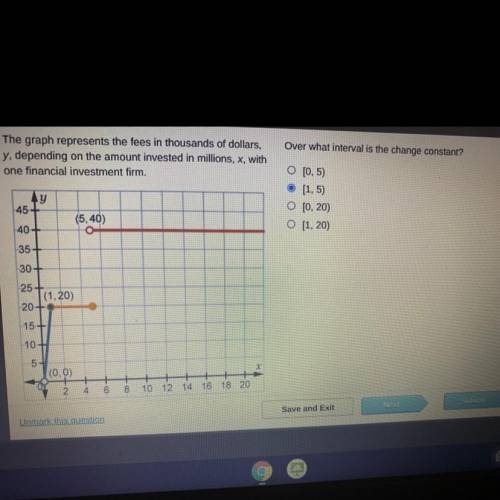
TiIMED TEST PLS HELP. The graph represents the fees in thousands of dollars,
y, depending on the amount invested in millions, x, with
one financial investment firm. Over what interval is the change constant? O[0,5) O[1,5) O[0,20) O[1,20)

Answers: 2


Other questions on the subject: Mathematics
Mathematics, 21.06.2019 15:30, sweetgigi5950
Sunday: 1 1 2 monday: 1 tuesday: 2 1 2 wednesday: 1 3 4 thursday: 2 friday: 1 1 2 saturday: 2 jenna is a swimmer and trains every day. the schedule shown outlines the number of hours she trains each day. what is the total number of hours that jenna trains during the week?
Answers: 3
Mathematics, 22.06.2019 03:00, thestarlexyp32wpj
The perimeter of ? cde is 55 cm. a rhombus dmfn is inscribed in this triangle so that vertices m, f, and n lie on the sides cd , ce , and de respectively. find cd and de if cf=8 cm and ef=12 cm. the answer is not cd=20 and de=15. i have tried that one, it does not work.
Answers: 3
You know the right answer?
TiIMED TEST PLS HELP. The graph represents the fees in thousands of dollars,
y, depending on the am...
Questions in other subjects:
Mathematics, 08.12.2020 14:00

Mathematics, 08.12.2020 14:00
Mathematics, 08.12.2020 14:00


