Mathematics, 28.05.2021 22:30 ajyoung3142005oztpya
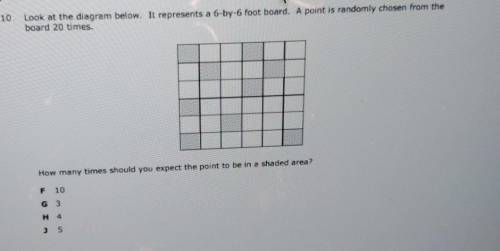
Look at the diagram below it represents a 6 by 6 foot board a point at random children from for 20 times


Answers: 3


Other questions on the subject: Mathematics

Mathematics, 21.06.2019 14:30, paulinahunl17
The minimum wage in washington has been increasing over the last ten years. years 2000 2001 2002 2003 2004 2005 2006 2007 2008 2009 2010 washington state minimum wage $6.50 $6.72 $6.90 $7.01 $7.16 $7.35 $7.63 $7.93 $8.07 $8.55 $8.55 a) find the linear regression equation for the minimum wage in washington using this data ( x 0 in 2000). round to the thousandths. b) what is the slope? specifically, what does the slope represent in the real world context? c) what is the y-intercept? specifically, what does the y-intercept represent in the real world context? d) write your equation as a function of x. e) if you do not earn a college degree and you are earning minimum wage in 2020, what do you predict you will be earning per hour with the linear regression equation? f) if the trend continues, when will the minimum wage be $15 an hour? 3. why are your answers to #1d and #2a above different? which do you think is more accurate (#1 or #2) and why
Answers: 1


Mathematics, 21.06.2019 23:00, Ellafrederick
Janie has $3. she earns $1.20 for each chore she does and can do fractions of chores. she wants to earn enough money to buy a cd for $13.50.
Answers: 2

Mathematics, 22.06.2019 02:00, fespinoza019
The null and alternate hypotheses are: h0: μ1 ≤ μ2 h1: μ1 > μ2 a random sample of 22 items from the first population showed a mean of 113 and a standard deviation of 12. a sample of 16 items for the second population showed a mean of 99 and a standard deviation of 6. use the 0.01 significant level. find the degrees of freedom for unequal variance test. (round down your answer to the nearest whole number.) state the decision rule for 0.010 significance level. (round your answer to 3 decimal places.) compute the value of the test statistic. (round your answer to 3 decimal places.) what is your decision regarding the null hypothesis? use the 0.01 significance level.
Answers: 1
You know the right answer?
Look at the diagram below it represents a 6 by 6 foot board a point at random children from for 20 t...
Questions in other subjects:


Mathematics, 07.12.2020 14:00


History, 07.12.2020 14:00


