
Mathematics, 28.05.2021 19:10 kiki9555
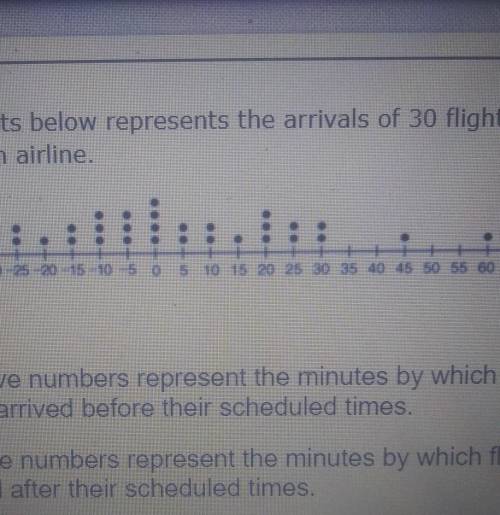
Part A Create a frequency table for this plot. Part B What is the median arrival time for the airline plotted above? The dot plots below represents the arrivals of 30 flights made by an airline. Negative numbers represent the minutes by which flights arrived before their scheduled times. numbers represent the minutes by which flights arrived after their scheduled times. Zero indicates the flight arrived at its scheduled time. In the picture theres also one 35

Answers: 2


Other questions on the subject: Mathematics
Mathematics, 21.06.2019 16:30, angelisabeast5430
Sam claims that cos x =sin y if x and y are congruent angels. is sam correct ?
Answers: 2
Mathematics, 21.06.2019 19:00, bellbradshaw16
Suppose that one doll house uses the 1 inch scale, meaning that 1 inch on the doll house corresponds to 1/2 foot for life-sized objects. if the doll house is 108 inches wide, what is the width of the full-sized house that it's modeled after? in inches and feet.
Answers: 2
Mathematics, 21.06.2019 19:30, ochoanene822
Which of the following transformations will always produce a congruent figure?
Answers: 2
Mathematics, 21.06.2019 20:30, qveenvslayin
Erin bought christmas cards for $2 each to send to her family and friends. which variable is the dependent variable?
Answers: 1
You know the right answer?
Part A Create a frequency table for this plot. Part B What is the median arrival time for the airlin...
Questions in other subjects:

Biology, 02.04.2021 04:40

Biology, 02.04.2021 04:40

Mathematics, 02.04.2021 04:40
Mathematics, 02.04.2021 04:40


