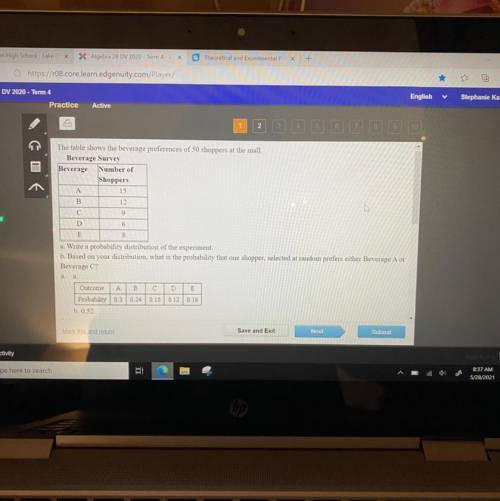
The table shows the beverage preferences of 50 shoppers at the mall.
Beverage Survey
Beverage...

Mathematics, 28.05.2021 16:50 ctyrector
The table shows the beverage preferences of 50 shoppers at the mall.
Beverage Survey
Beverage Number of
Shoppers
A
15
B
12
с
9
D
6
E
8
a. Write a probability distribution of the experiment.
b. Based on your distribution, what is the probability that one shopper, selected at random prefers either Beverage A or
Beverage C?
a. a.
Outcome A B С D E
Probability 0.3 0.24 0.18 0.12 0.16
b. 0.52
Mark this and return
Save and Exit
Next
Submit

Answers: 1


Other questions on the subject: Mathematics
Mathematics, 21.06.2019 18:30, PineaPPle663
Which one ? is the answer and how to find this answer
Answers: 2
Mathematics, 21.06.2019 20:00, jortizven0001
Seymour is twice as old as cassandra. if 16 is added to cassandra’s age and 16 is subtracted from seymour’s age, their ages become equal. what are their present ages? show !
Answers: 1
Mathematics, 21.06.2019 20:30, anniekwilbourne
Kayla made observations about the sellin price of a new brand of coffee that sold in the three different sized bags she recorded those observations in the following table 6 is $2.10 8 is $2.80 and 16 is to $5.60 use the relationship to predict the cost of a 20oz bag of coffee.
Answers: 3
You know the right answer?
Questions in other subjects:

Biology, 27.09.2021 22:50
Mathematics, 27.09.2021 22:50
Mathematics, 27.09.2021 22:50


History, 27.09.2021 22:50
English, 27.09.2021 22:50
Mathematics, 27.09.2021 23:00
Mathematics, 27.09.2021 23:00
Mathematics, 27.09.2021 23:00


