
Mathematics, 27.05.2021 21:50 live4dramaoy0yf9
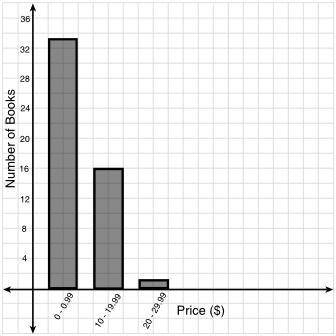
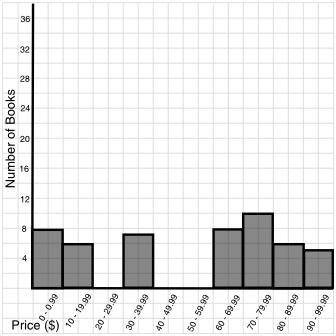
How do the graphs of the combined data compare to the original graphs? Compared to the original graphs, do the new graphs make it easier or more difficult to estimate the price of a book?

Answers: 1


Other questions on the subject: Mathematics
Mathematics, 21.06.2019 15:50, aidanfbussiness
If the dimensions of a rectangular prism are 5 ft x 3.5 ft x 2 ſt, what is the surface area?
Answers: 1
Mathematics, 22.06.2019 03:30, tremainewoodley3030
Identify the number as a rational or irrational. explai. 291.87
Answers: 2
Mathematics, 22.06.2019 08:40, culturedxnat
You remove a cheesecake from the oven with an ideal internal temperature of 165 f and place it into a 35 f refrigerator. after 10 minutes, the cheesecake has cooled to 15o f if you must wait until the cheesecake has cooled to 70 before you eat it, how long will you have to wait?
Answers: 2
Mathematics, 22.06.2019 09:00, mdngndntbdnbd
At a salon, there are nail technicians and hair stylists. the salon owner wants to expand, but can only afford to add no more than 9 new positions. a typical nail technician can see 10 clients per day. a typical hair stylist can see 15 clients per day. the salon owner hopes to be able to see more than 100 clients per day. the new positions constraint is represented by x + y ≤ 9, where x represents the number of nail technicians and y represents the number of hair stylists. find the inequality representing the clients constraint for this situation.
Answers: 1
You know the right answer?
How do the graphs of the combined data compare to the original graphs?
Compared to the original gra...
Questions in other subjects:

Mathematics, 05.05.2020 02:47
History, 05.05.2020 02:47

Mathematics, 05.05.2020 02:47
Mathematics, 05.05.2020 02:47


