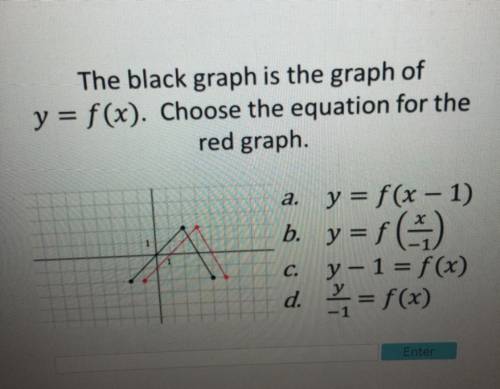
The black graph is the graph of y=f(x). Choose the equation for the red graph
...

Mathematics, 27.05.2021 08:10 jayy0378
The black graph is the graph of y=f(x). Choose the equation for the red graph

Answers: 3


Other questions on the subject: Mathematics
Mathematics, 21.06.2019 16:30, pandamaknae2003
Iwant to know what 3g+5h+4g-2h is my teacher is too selfish to tell us
Answers: 1
Mathematics, 21.06.2019 19:50, gameranonymous266
Examine the two-step equation. − 7 4 + x 4 = 2 which property of operations allows you to add the same constant term to both sides? amultiplication property of equality bdivision property of equality caddition property of equality dsubtraction property of equality
Answers: 2
Mathematics, 21.06.2019 22:00, ashhleyjohnson
After a dreary day of rain, the sun peeks through the clouds and a rainbow forms. you notice the rainbow is the shape of a parabola. the equation for this parabola is y = -x2 + 36. graph of a parabola opening down at the vertex 0 comma 36 crossing the x–axis at negative 6 comma 0 and 6 comma 0. in the distance, an airplane is taking off. as it ascends during take-off, it makes a slanted line that cuts through the rainbow at two points. create a table of at least four values for the function that includes two points of intersection between the airplane and the rainbow. analyze the two functions. answer the following reflection questions in complete sentences. what is the domain and range of the rainbow? explain what the domain and range represent. do all of the values make sense in this situation? why or why not? what are the x- and y-intercepts of the rainbow? explain what each intercept represents. is the linear function you created with your table positive or negative? explain. what are the solutions or solution to the system of equations created? explain what it or they represent. create your own piecewise function with at least two functions. explain, using complete sentences, the steps for graphing the function. graph the function by hand or using a graphing software of your choice (remember to submit the graph).
Answers: 2
Mathematics, 21.06.2019 23:00, sugar1014
According to a study conducted in 2015, 18% of shoppers said that they prefer to buy generic instead of name-brand products. suppose that in a recent sample of 1500 shoppers, 315 stated that they prefer to buy generic instead of name-brand products. at a 5% significance level, can you conclude that the proportion of all shoppers who currently prefer to buy generic instead of name-brand products is higher than .18? use both the p-value and the critical-value approaches.
Answers: 1
You know the right answer?
Questions in other subjects:

History, 12.03.2020 19:16

Mathematics, 12.03.2020 19:16


