
Mathematics, 27.05.2021 03:50 EMQPWE
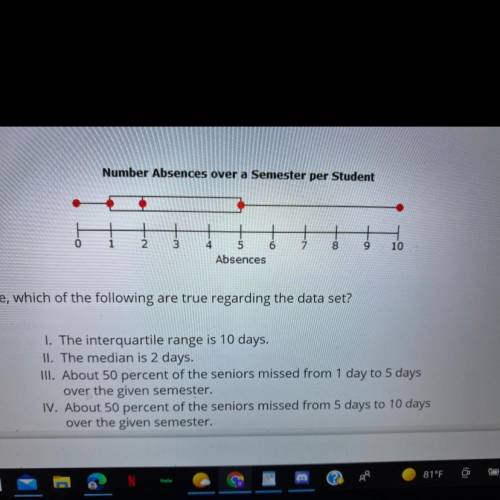
The box plot below. represents the number of absences, per student, over a semester by a group of seniors at Green Hill
High School.
+
Number Absences over a Semester per Student
(SEE PICTURE)
Using the box plot above,
which of the following are true regarding the data set?
I. The interquartile range is 10 days.
II. The median is 2 days.
III. About 50 percent of the seniors missed from 1 day to 5 days over the given semester.
IV. About 50 percent of the seniors missed from 5 days to 10 days
A. I & II
B. I & III
C. I & III
D. II & IV

Answers: 2


Other questions on the subject: Mathematics
Mathematics, 21.06.2019 15:00, wrightstephanie193
Which expression is equivalent to 2x^2+7x+4?
Answers: 3
Mathematics, 22.06.2019 00:50, 20alyssityh224
Arectangle has a perimeter of 24 inches. if the width is 5 more than twice the length, what are the dimensions of the rectangle?
Answers: 3
You know the right answer?
The box plot below. represents the number of absences, per student, over a semester by a group of se...
Questions in other subjects:

Social Studies, 16.02.2021 02:50

History, 16.02.2021 02:50
Mathematics, 16.02.2021 02:50


