
Mathematics, 26.05.2021 22:00 grettelyesenia
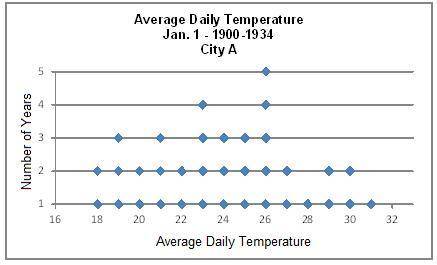
The graph below shows the average daily temperatures on January 1 from 1900 to 1934 for city A. The mean of the temperatures in the chart is 24° with standard deviation of 4°. How many years had temperatures within one standard deviation of the mean?
Answers: 20, 25, 28, 35
TIMED HELP QUICKLY PLEASE!!! 20 pts

Answers: 1


Other questions on the subject: Mathematics
Mathematics, 21.06.2019 15:30, 24lfoster
According to statistics a person will devote 32 years to sleeping and watching tv. the number of years sleeping will exceed the number of years watching tv by 18. over a lifetime, how many years will the person spend on each of these activities
Answers: 1
Mathematics, 21.06.2019 18:00, MayFlowers
Name each raycalculation tip: in ray "ab", a is the endpoint of the ray.
Answers: 1
Mathematics, 21.06.2019 19:00, adrianwoods1507
1c) the number 131 is a term in the sequence defined by the explicit rule f(n)=5n-4. which term in the sequence is 131? 2a) write the first four terms of the function f(n)=n^2-1 2b) what is the 10th term of the sequence defined by the explicit rule f(n)=n^2-1 2c) the number 224 is a term in the sequence defined by the explicit rule f(n)=n^2-1. which term in the sequence is 224?
Answers: 2
You know the right answer?
The graph below shows the average daily temperatures on January 1 from 1900 to 1934 for city A. The...
Questions in other subjects:
Mathematics, 29.01.2021 07:20
Mathematics, 29.01.2021 07:20

Physics, 29.01.2021 07:20

Chemistry, 29.01.2021 07:20
Mathematics, 29.01.2021 07:20
Mathematics, 29.01.2021 07:20


