
Mathematics, 26.05.2021 17:30 flowersthomas1969
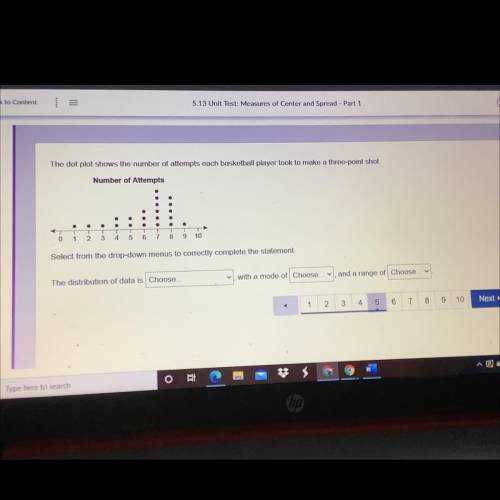
The dot plot shows the number of attempts each basketball player took to make a three-point shot.
Number of Attempts
0
1
1
2
3
4
5
6
7
8
9
10
Select from the drop-down menus to correctly complete the statement.
The distribution of data is Choose...
with a mode of Choose... v
and a range of Choose...

Answers: 3


Other questions on the subject: Mathematics
Mathematics, 22.06.2019 00:30, steviedude316
Round each of the decimals to the nearest hundredth a. 0.596 b. 4.245 c. 53.6843 d. 17.999
Answers: 2
Mathematics, 22.06.2019 06:00, jojo492192
Mr. chen is parking in a lot downtown. the graph shows the relationship between the time and the total cost of parking. evaluate the function for and input of 10.
Answers: 2
Mathematics, 22.06.2019 08:20, pitmmaKaos5499
Using the properties of equality, find the value of x in the equation below. 4x(2 + 8) = -8 type your answer as a fraction so that you give the exact answer not an estimate.
Answers: 1
You know the right answer?
The dot plot shows the number of attempts each basketball player took to make a three-point shot.
N...
Questions in other subjects:
Mathematics, 03.10.2021 02:50
Mathematics, 03.10.2021 02:50

English, 03.10.2021 02:50


Business, 03.10.2021 02:50


