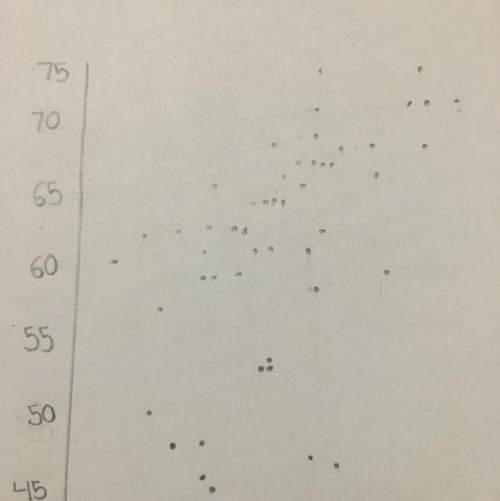
Which statement best describes this graph?
As the 2-value increases by 1, the y-value
decreas...

Mathematics, 26.05.2021 05:20 hunterl0513
Which statement best describes this graph?
As the 2-value increases by 1, the y-value
decreases by 2; the x-intercept is -1.
As the u-value increases by 1, the y-value
decreases by 2: the x-intercept is-2.
As the x-value increases by 1, the y-value
decreases by z; the x-intercept is – 2.
As the x-value increases by 1, the y-value
decreases by 3: the z-intercept is – 1.

Answers: 3


Other questions on the subject: Mathematics

Mathematics, 21.06.2019 14:30, sierram298
The multiplication property of zero states that the product of any number and 0 is 0. what must be true about either a or b to make ab=0
Answers: 1

Mathematics, 21.06.2019 23:10, skylar1315
Determine the required value of the missing probability to make the distribution a discrete probability distribution. x p(x) 3 0.23 4 ? 5 0.51 6 0.08 p(4) = nothing (type an integer or a decimal.)
Answers: 3

Mathematics, 22.06.2019 02:00, danielmartinez024m
The plant were you work has a cylindrical oil tank that is 2.5 feet across on the inside and 10 feet high. the depth of the oil in the tank is 2 feet. about how many gallons of oil are in the tank?
Answers: 2

Mathematics, 22.06.2019 02:00, DESIREEHANCOTTE10
Add. express your answer in simplest form. 12 9/10+2 2/3 = i need u guys to me find the answer to this question
Answers: 1
You know the right answer?
Questions in other subjects:


History, 22.08.2019 10:20


History, 22.08.2019 10:20

Mathematics, 22.08.2019 10:20


Physics, 22.08.2019 10:20


Mathematics, 22.08.2019 10:20

Mathematics, 22.08.2019 10:20


