
Mathematics, 26.05.2021 02:40 hosteenimport21
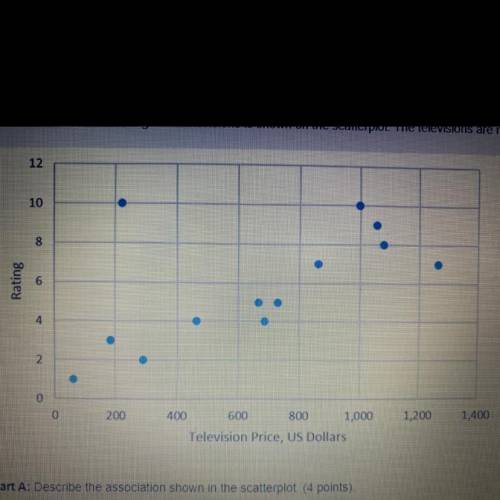
The cost and customer rating of 13 televisions is shown on the scatterplot. the televisions are rated on a scale of 0-10.
Part A: Describe the association shown in the scatter plot.
Part B: Give an example of a data point that affects the appropriateness of using a liner regression model to fit all the data. Explain.
Part C: Give an example of a television that is cost effective and rated highly by customers.

Answers: 1


Other questions on the subject: Mathematics
Mathematics, 21.06.2019 20:30, melissakm77
Select all the expressions that will include a remainder.
Answers: 1
You know the right answer?
The cost and customer rating of 13 televisions is shown on the scatterplot. the televisions are rate...
Questions in other subjects:


Computers and Technology, 16.04.2020 02:55
Mathematics, 16.04.2020 02:55
Mathematics, 16.04.2020 02:55


