
Mathematics, 25.05.2021 21:00 kittybatch345
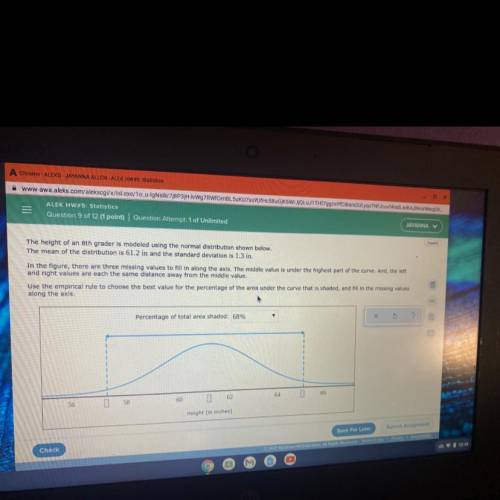
The height of an 8th grader is modeled using the normal distribution shown below.
The mean of the distribution is 61.2 in and the standard deviation is 1.3 in.
In the figure, there are three missing values to fill in along the axis. The midde value is under the highest part of the curve. And, the left
and right values are each the same distance away from the middle value.
Use the empirical rule to choose the best value for the percentage of the area under the curve that is shaded, and nil in the missing values
along the axis.

Answers: 3


Other questions on the subject: Mathematics
Mathematics, 21.06.2019 18:00, heids17043
Ageologist had two rocks on a scale that weighed 4.6 kilograms together. rock a was 0.5 of the total weight. how much did rock a weigh?
Answers: 1
Mathematics, 21.06.2019 23:40, chanavictor2688
Aright cylinder has a diameter of 8 m and a height of 6m. what is the volume of the cylinder
Answers: 1
You know the right answer?
The height of an 8th grader is modeled using the normal distribution shown below.
The mean of the d...
Questions in other subjects:

Biology, 13.11.2021 14:00

Health, 13.11.2021 14:00

Mathematics, 13.11.2021 14:00
Mathematics, 13.11.2021 14:00


Business, 13.11.2021 14:00


Arts, 13.11.2021 14:00


