
Mathematics, 25.05.2021 18:50 KKHeffner02
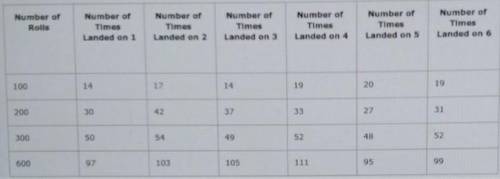
Shelly is rolling a six-sided number cube and recording her results in a chart.
Which is BEST supported by the data in the chart?
A. When viewing the data for rolling a six, as the number of rolls increases, the experimental probability becomes closer to equal to the theoretical probability.
B. When viewing the data for rolling a two, as the number of rolls increases, the experimental probability becomes closer to equal to the theoretical probability.
C. When viewing the data for rolling a four, as the number of rolls increases, the experimental probability becomes closer to equal to the theoretical probability.
D. When viewing the data for rolling a one, as the number of rolls increases, the experimental probability becomes closer to equal to the theoretical probability.
***(NO LINKS AND ACTUALLY ANSWER)***

Answers: 2


Other questions on the subject: Mathematics
Mathematics, 21.06.2019 13:00, drakesmith43
The production line where you work can assemble 5 appliers every 30 minutes at this rate how long should it take the line to assemble 125 amplifiers
Answers: 1
Mathematics, 21.06.2019 18:00, 22justinmcminn
Darian wants to build a regulation size pool table that is 9 feet in length. he plans he ordered are 18 by 36 inches. what is the scale factor of the dilation he must use to build a regulation pool table
Answers: 1
Mathematics, 21.06.2019 22:20, wrolle
The volume, v, of a rectangular prism is determined using the formula, where / is the length, w is the width, and his theheight of the prism. carltren solves for w and writes the equivalent equation w=using this formula, what is the width of a rectangular prism that has a volume of 138.24 cubic inches, a height of 9.6 inches, and a length of 3.2 inches?
Answers: 2
You know the right answer?
Shelly is rolling a six-sided number cube and recording her results in a chart.
Which is BEST sup...
Questions in other subjects:

English, 22.02.2021 21:40

Mathematics, 22.02.2021 21:40
Mathematics, 22.02.2021 21:40

English, 22.02.2021 21:40


