
Mathematics, 25.05.2021 18:10 Echo009
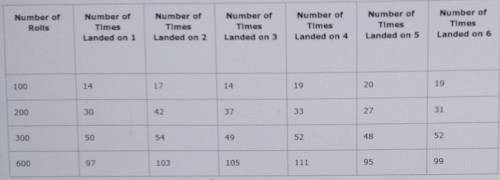
Shelly is rolling a six-sided number cube and recording her results in a chart.
Which is BEST supported by the data in the chart?
A. When viewing the data for rolling a six, as the number of rolls increases, the experimental probability becomes closer to equal to the theoretical probability.
B. When viewing the data for rolling a two, as the number of rolls increases, the experimental probability becomes closer to equal to the theoretical probability.
C. When viewing the data for rolling a four, as the number of rolls increases, the experimental probability becomes closer to equal to the theoretical probability.
D. When viewing the data for rolling a one, as the number of rolls increases, the experimental probability becomes closer to equal to the theoretical probability.
(NO LINKS)

Answers: 1


Other questions on the subject: Mathematics
Mathematics, 21.06.2019 20:30, gwendallinesikes
Is the point (0, 8) on the x-axis or y-axis? how do you know?
Answers: 2
Mathematics, 22.06.2019 02:00, mathhelppls14
1. the manager of collins import autos believes the number of cars sold in a day (q) depends on two factors: (1) the number of hours the dealership is open (h) and (2) the number of salespersons working that day (s). after collecting data for two months (53 days), the manager estimates the following log-linear model: q 4 equation 1 a. explain, how to transform the log-linear model into linear form that can be estimated using multiple regression analysis. the computer output for the multiple regression analysis is shown below: q4 table b. how do you interpret coefficients b and c? if the dealership increases the number of salespersons by 20%, what will be the percentage increase in daily sales? c. test the overall model for statistical significance at the 5% significance level. d. what percent of the total variation in daily auto sales is explained by this equation? what could you suggest to increase this percentage? e. test the intercept for statistical significance at the 5% level of significance. if h and s both equal 0, are sales expected to be 0? explain why or why not? f. test the estimated coefficient b for statistical significance. if the dealership decreases its hours of operation by 10%, what is the expected impact on daily sales?
Answers: 2
You know the right answer?
Shelly is rolling a six-sided number cube and recording her results in a chart.
Which is BEST suppo...
Questions in other subjects:


Mathematics, 14.03.2020 03:23


