
Mathematics, 24.05.2021 20:30 zachthomas024
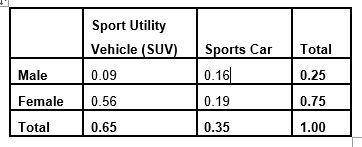
The following table shows the probability of females and males preferring to drive an SUV or a sports car.
(SUV) Sports Car Total
Male 0.09 0.16 0.25
Female 0.56 0.19 0.75
Total 0.65 0.35 1.00
(a) Are being male and preferring to drive a sports car independent or not independent? Show all calculations to support your answer. Round answer to the nearest hundredth. Be sure to answer the question.
Let A = being a male
Let B = preferring to drive a sports car
(b) Are being female and preferring to drive an SUV independent or not independent? Show all calculations to support your answer. Round answer to the nearest hundredth. Be sure to answer the question.
Let A = being a female
Let B = preferring to drive an SUV

Answers: 3


Other questions on the subject: Mathematics
Mathematics, 21.06.2019 20:10, tiggyandrep2dbee
Look at the hyperbola graphed below. the hyperbola gets very close to the red lines on the graph, but it never touches them. which term describes each of the red lines? o o o o a. asymptote b. directrix c. focus d. axis
Answers: 3
Mathematics, 21.06.2019 21:00, bloodmoonangel01
Deepak plotted these points on the number line. point a: –0.3 point b: – 3 4 point c: – 11 4 point d: –0.7 which point did he plot incorrectly?
Answers: 2
You know the right answer?
The following table shows the probability of females and males preferring to drive an SUV or a sport...
Questions in other subjects:


Biology, 10.07.2019 03:30
History, 10.07.2019 03:30
Mathematics, 10.07.2019 03:30

Social Studies, 10.07.2019 03:30

Computers and Technology, 10.07.2019 03:30


