
Mathematics, 24.05.2021 14:00 5041
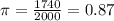
The Consumer Reports National Research Center conducted a telephone survey of 2,000 adults to learn about the major economic concerns for the future. The survey results showed that 1,740 of the respondents think the future health of Social Security is a major economic concern.
Required:
a. What is the point estimate of the population proportion of adults who think the future health of Social Security is a major economic concern.
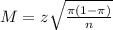
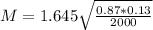
b. At 90% confidence, what is the margin of error?
c. Develop a 90% confidence interval for the population proportion of adults who think the future health of Social Security is a major economic concern.
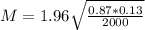
d. Develop a 95% confidence interval for this population proportion.

Answers: 2
 , and a confidence level of
  , we have the following confidence interval of proportions.
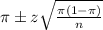
 .
.

 , z is the value of Z that has a p-value of
 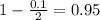 , so
, so  .
.


 , z is the value of Z that has a p-value of
 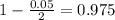 , so
, so  .
. 


Other questions on the subject: Mathematics
Mathematics, 21.06.2019 15:30, juli8350
The average hourly earnings for a construction worker is projected to be $24.50 in 2012. jason wants to join the construction work force after he graduates in 2012. his friend tells him that average hourly earnings for construction workers will rise by 2% from 2009 to 2012. based on the data below, assuming that the projected hourly earnings are correct, is jason’s friend’s statement accurate? construction industry - average hourly earnings, 2000-2009 a. his friend’s statement is accurate. the average hourly earnings will increase by 2%. b. his friend’s statement is not accurate. the percent increase will be more than 2% c. his friend’s statement is not accurate. the percent increase will be less than 2% d. his friend’s statement is not accurate. the average hourly earnings will decrease
Answers: 3
Mathematics, 21.06.2019 17:30, markkessler7149
It takes jonas 7 1/4 minutes to run the mile. it takes mario 8 5/12 to run the mile. how much faster is jonas than mario? 5/6 minute 1 1/3 minutes 1 1/6 minutes 1 1/2 minutesi will give points and brainlest
Answers: 2
Mathematics, 21.06.2019 18:00, mdlemuslopez
The graph shown is the graph of which function?
Answers: 2
You know the right answer?
The Consumer Reports National Research Center conducted a telephone survey of 2,000 adults to learn...
Questions in other subjects:

History, 10.12.2020 01:00

Social Studies, 10.12.2020 01:00
Mathematics, 10.12.2020 01:00

Mathematics, 10.12.2020 01:00


