Step 1: Research and Macronutrients
Research the nutritional needs of the following two men:
<...

Mathematics, 24.05.2021 02:50 amohammad6
Step 1: Research and Macronutrients
Research the nutritional needs of the following two men:
Male 1: 30-year-old male, long-distance runner who weighs 140 lbs. and has a body fat percentage of 20 percent. He is 5’10” tall.
Male 2: 30-year-old male, works a desk job all day. He is sedentary and the only exercise he gets is a short walk once a week. He weighs 190 lbs. and his body fat percentage is 30 percent. He is also 5’10” tall.
Based on your research, use your best judgment to estimate the following nutritional requirements for each man. Record your information on the provided sheet.
Daily caloric needs
Daily intake of macronutrients: protein, fat, carbohydrates (in grams)
Daily water intake (in cups)
Any recommended micronutrients or supplements (optional)
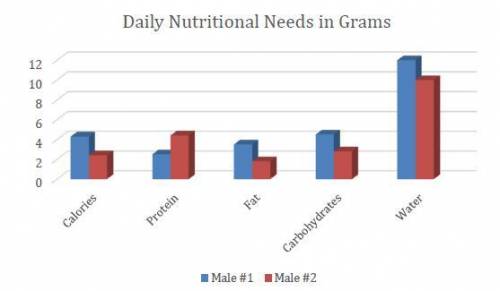
Step 2: Graph
Create a bar graph comparing the daily nutritional needs of each man. See example below for reference. Note: The following graph is merely an example on how to design your graph; the data included is not relevant.
Example picture below

Answers: 3


Other questions on the subject: Mathematics
Mathematics, 21.06.2019 16:00, sebastianapolo5
Asalesperson earns $320 per week plus 8% of her weekly sales. the expression representing her earnings is 320 + 0.08x. which of the following describes the sales necessary for the salesperson to earn at least $1000 in the one week?
Answers: 2
Mathematics, 21.06.2019 21:30, cassandramanuel
Carl's candies has determined that a candy bar measuring 3 inches long has a z-score of +1 and a candy bar measuring 3.75 inches long has a z-score of +2. what is the standard deviation of the length of candy bars produced at carl's candies?
Answers: 1
Mathematics, 22.06.2019 01:10, graymonky12
The graph below shows the line of best fit for data collected on the number of cell phones and cell phone cases sold at a local electronics store on twelve different days. number of cell phone cases sold 50 * 0 5 10 15 20 25 30 35 40 45 number of cell phones sold which of the following is the equation for the line of best fit? a. y = 0.8x b. y = 0.2x c. y=0.5x d. y = 0.25x
Answers: 3
You know the right answer?
Questions in other subjects:

Biology, 17.10.2019 05:00


