
Mathematics, 24.05.2021 02:20 juliajaelyn9658
2A.8C
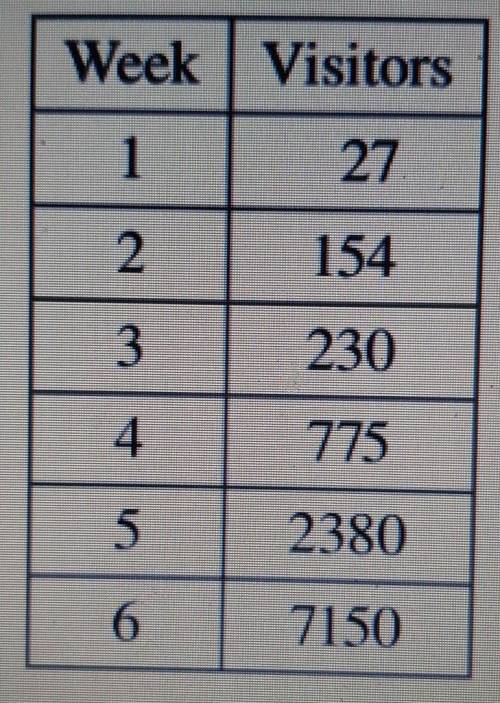
The chart below shows the number of visitors to a website during the first six weeks after its launch. Use an exponential regression equation that best models this data to predict the week when the website will have over one hundred thousand visitors.
A. week 8
B. week 9
C. week 7
D. week 10

Answers: 3


Other questions on the subject: Mathematics
Mathematics, 21.06.2019 20:30, destinyharris8502
I’m on question 7 it says a covered water tank is in the shape of a cylinder the tank has a 28 inch diameter and a height of 66 inches to the nearest square inch what is the surface area of the water tank
Answers: 2
Mathematics, 21.06.2019 21:00, hernandez09297
At oaknoll school, 90 out of 270 students on computers. what percent of students at oak knoll school do not own computers? round the nearest tenth of a percent.
Answers: 1
Mathematics, 21.06.2019 21:30, anaemigarcia
What is the solution to this system of equations? y= 2x - 3.5 x - 2y = -14
Answers: 2
Mathematics, 22.06.2019 00:20, Imagine2013
Given sin28.4=.4756, cos28.4=.8796, and tan28.4=.5407 find the cos of 61.6
Answers: 2
You know the right answer?
2A.8C
The chart below shows the number of visitors to a website during the first six weeks after it...
Questions in other subjects:

History, 18.10.2020 01:01

Mathematics, 18.10.2020 01:01
Mathematics, 18.10.2020 01:01

Arts, 18.10.2020 01:01
Mathematics, 18.10.2020 01:01


