
Mathematics, 23.05.2021 04:40 neariah24
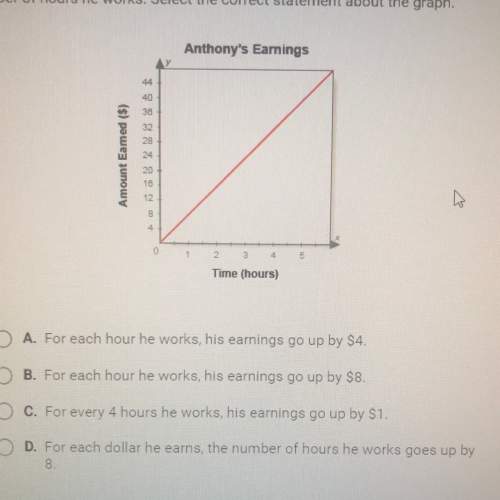
8. The circle graph below shows the most popular car colors among students.
Favorite Car Color
Other (11%)
Blue (7%)
White (19%)
Black (266)
Red (37%)
If the total number of students surveyed is 1,350, approximately how many preferred black?
A. about 300
C. about 500
B.
about 450
D. about 350


Answers: 1


Other questions on the subject: Mathematics
Mathematics, 21.06.2019 21:00, angelaguero536
In the field of thermodynamics, rankine is the unit used to measure temperature. one can convert temperature from celsius into rankine using the formula , what is the temperature in celsius corresponding to r degrees rankine? a. 9/5(c - 273) b. 9/5(c + 273) c. 5/9( c - 273) d. 5/9( c + 273)
Answers: 1
Mathematics, 21.06.2019 23:00, ManBun99
Assume that there is a 11% rate of disk drive failure in a year. a. if all your computer data is stored on a hard disk drive with a copy stored on a second hard disk drive, what is the probability that during a year, you can avoid catastrophe with at least one working drive? b. if copies of all your computer data are stored on four independent hard disk drives, what is the probability that during a year, you can avoid catastrophe with at least one working drive?
Answers: 2
You know the right answer?
8. The circle graph below shows the most popular car colors among students.
Favorite Car Color
Questions in other subjects:

Physics, 25.07.2019 12:30


Mathematics, 25.07.2019 12:30
Mathematics, 25.07.2019 12:30


