The black graph is the graph of
y = f(x). Choose the equation for the
red graph.
...

Mathematics, 23.05.2021 01:00 alexabdercmur
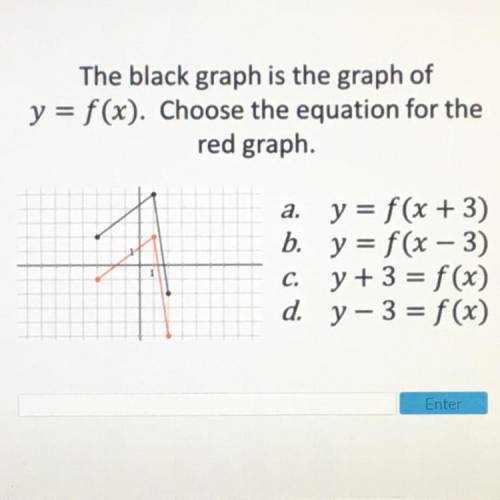
The black graph is the graph of
y = f(x). Choose the equation for the
red graph.
a. y = f(x + 3)
b. y = f(x - 3)
c. y + 3 = f(x)
d. y-3 = f(x)

Answers: 3


Other questions on the subject: Mathematics
Mathematics, 21.06.2019 14:50, queenkendra16
Which expression is equivalent to 4 square root 6 divided by 3 root 2
Answers: 1
Mathematics, 22.06.2019 06:30, angelinaavila06
Asa a yogurt shop allows its customers to add, for no charge, 3 toppings to any yogurt purchased. if the store has 18 possible toppings, how many different 3-topping combinations can a customers choose?
Answers: 1
Mathematics, 22.06.2019 07:20, bullockarwen
Bill makes leather shoes. he charges $45 for a pair of women's shoes and $50 for a pair of men's shoes. he sells x pairs of women's shoes and y pairs of men's shoes each week and earns a total income of $2,500. this situation can be represented by the equation . if bill has no female customers during a particular week, he needs to sell pairs of men's shoes to earn his weekly income of $2,500.
Answers: 1
You know the right answer?
Questions in other subjects:


English, 09.12.2019 03:31


