DE
1. 8.SP.1.1
Tony collected data on the years of
employment and the annual salaries o...

Mathematics, 22.05.2021 21:10 deedee2616
DE
1. 8.SP.1.1
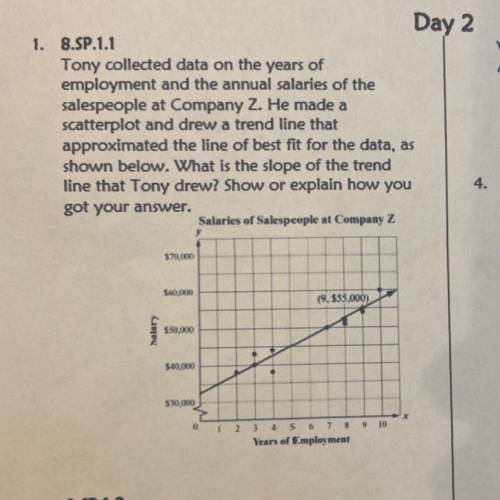
Tony collected data on the years of
employment and the annual salaries of the
salespeople at Company Z. He made a
scatterplot and drew a trend line that
approximated the line of best fit for the data, as
shown below. What is the slope of the trend
line that Tony drew? Show or explain how you
got your answer.
Salaries of Salespeople at Company Z
$70,000
SH0.000
(9.555,000)
Salary
$50,000
$10,000
$10,000
1 2 3 4 5 6 7 8 9 10
Years of Employment

Answers: 3


Other questions on the subject: Mathematics
Mathematics, 21.06.2019 14:30, Pumpkinputters
What is the inverse of the function f(x)=4x+8
Answers: 1
Mathematics, 21.06.2019 20:00, GreatBaconGamer
Solve for x and y a x= 13.3 y= 16.7 b x= 23.3 y= 12.5 c x= 7.5 y= 16.7 d x=7.5 y= 12.5
Answers: 1
Mathematics, 21.06.2019 20:30, strodersage
Ametal rod is 2/5 meters long. it will be cut into pieces that are each 1/30 meters long. how many pieces will be made from the rod?
Answers: 1
Mathematics, 21.06.2019 22:00, deannajd03
Which two transformations are applied to pentagon abcde to create a'b'c'd'e'? (4 points) translated according to the rule (x, y) ? (x + 8, y + 2) and reflected across the x-axis translated according to the rule (x, y) ? (x + 2, y + 8) and reflected across the y-axis translated according to the rule (x, y) ? (x + 8, y + 2) and reflected across the y-axis translated according to the rule (x, y) ? (x + 2, y + 8) and reflected across the x-axis
Answers: 1
You know the right answer?
Questions in other subjects:

Computers and Technology, 16.02.2021 23:50

English, 16.02.2021 23:50

Chemistry, 16.02.2021 23:50

Mathematics, 16.02.2021 23:50
Mathematics, 16.02.2021 23:50

Mathematics, 16.02.2021 23:50

History, 16.02.2021 23:50
Mathematics, 16.02.2021 23:50


