
Mathematics, 22.05.2021 05:20 icario1224
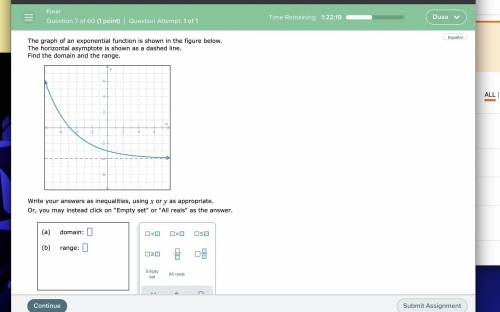
The graph of an exponential function is shown in the figure below.
The horizontal asymptote is shown as a dashed line.
Find the domain and the range.
y246-2-4-6x246-2-4-6
Write your answers as inequalities, using or as appropriate.
Or, you may instead click on "Empty set" or "All reals" as the answer.
(a) domain:
(b) range:

Answers: 2


Other questions on the subject: Mathematics
Mathematics, 21.06.2019 14:30, emily41950
Every time you drive you will experience a combination of driving conditions and environments.
Answers: 1
Mathematics, 21.06.2019 19:40, Suzispangler2264
What happens to the area as the sliders are adjusted? what do you think the formula for the area of a triangle is divided by 2?
Answers: 1
Mathematics, 21.06.2019 21:30, theoretical0315
Julie goes to the sports store and spends $40.50 before tax. she buys a pair of shorts for $21.75 and 3 pairs of socks that each cost the same amount. how much does each pair of socks cost? $$
Answers: 1
Mathematics, 21.06.2019 21:40, salinasroel22
In a survey of 1015 adults, a polling agency asked, "when you retire, do you think you will have enough money to live comfortably or not. of the 1015 surveyed, 534 stated that they were worried about having enough money to live comfortably in retirement. construct a 90% confidence interval for the proportion of adults who are worried about having enough money to live comfortably in retirement.
Answers: 3
You know the right answer?
The graph of an exponential function is shown in the figure below.
The horizontal asymptote is show...
Questions in other subjects:
Mathematics, 26.06.2019 12:20

Biology, 26.06.2019 12:20

History, 26.06.2019 12:20

Chemistry, 26.06.2019 12:20
History, 26.06.2019 12:20

Mathematics, 26.06.2019 12:20
Mathematics, 26.06.2019 12:20


