
Mathematics, 21.05.2021 23:10 dondre54
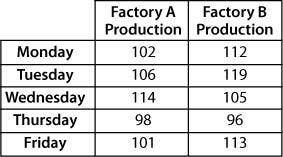
1. The CEO of Hot Tires compares factory production for his two factories using the data in the table shown below.
Which inference is valid?
A. Factory A has less variability in production because the range for factory A is greater than the range for factory B.
B. Factory B has less variability in production because the range for factory B is smaller than the range for factory A.
C. Factory B produced more tires than factory A because factory B has a mean of 109 and factory A has a mean of 104.2.
D. Factory B produced more tires than factory A because factory B has a median of 112 and factory A has a median of 102.

Answers: 2


Other questions on the subject: Mathematics
Mathematics, 22.06.2019 01:00, cthompson1107
First work with stencil one. use a combination of reflections, rotations, and translations to see whether stencil one will overlap with the original pattern. list the sequence of rigid transformations you used in your attempt, noting the type of transformation, the direction, the coordinates, and the displacement in
Answers: 3
Mathematics, 22.06.2019 04:10, luclaymom805
Ofis to ? o y=-3x-4o y=-3x+(-4)o y=-4 + 3xoy=-4-3x
Answers: 1
You know the right answer?
1. The CEO of Hot Tires compares factory production for his two factories using the data in the tabl...
Questions in other subjects:
Mathematics, 22.09.2021 01:00


History, 22.09.2021 01:00

Arts, 22.09.2021 01:00
Mathematics, 22.09.2021 01:00
Mathematics, 22.09.2021 01:00


