
Mathematics, 21.05.2021 22:10 pringleosmond
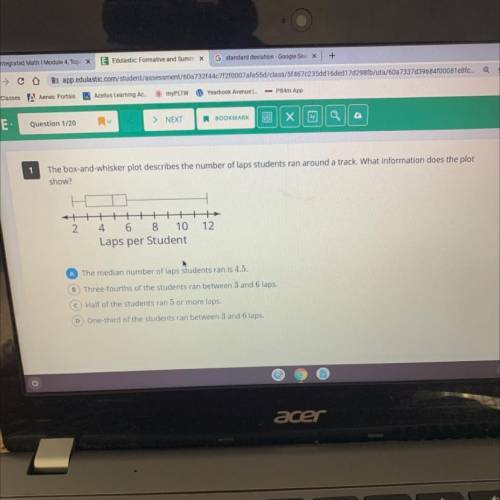
The box-and-whisker plot describes the number of laps students ran around a track. What information does the plot
show?
Laps per Student
A The median number of laps students ran is 4.5.
B Three-fourths of the students ran between 3 and 6 laps.
Half of the students ran 5 or more laps.
One-third of the students ran between 3 and 6 laps.

Answers: 2


Other questions on the subject: Mathematics
Mathematics, 21.06.2019 18:50, rosas8
Astudent draws two parabolas on graph paper. both parabolas cross the x-axis at (-4, 0) and (6,0). the y-intercept of thefirst parabola is (0, –12). the y-intercept of the second parabola is (0-24). what is the positive difference between the avalues for the two functions that describe the parabolas? write your answer as a decimal rounded to the nearest tenth.
Answers: 2
Mathematics, 21.06.2019 21:00, PotatoBananad
Given: circle o, cd is diameter, chord ab || cd. arc ab = 74°, find arc ca.
Answers: 1
You know the right answer?
The box-and-whisker plot describes the number of laps students ran around a track. What information...
Questions in other subjects:
Mathematics, 27.01.2021 08:40


Mathematics, 27.01.2021 08:50
Mathematics, 27.01.2021 08:50

Medicine, 27.01.2021 08:50
English, 27.01.2021 08:50


