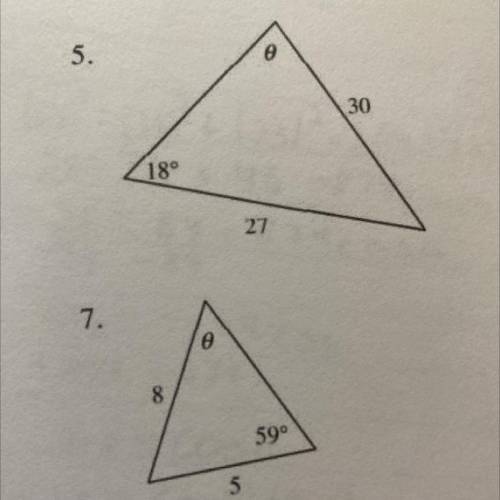
Law of sines or law of cosines
both 5. and 7.
...

Mathematics, 21.05.2021 21:00 fathimasaynas2975
Law of sines or law of cosines
both 5. and 7.

Answers: 1


Other questions on the subject: Mathematics
Mathematics, 21.06.2019 19:40, kms275
The cross-sectional areas of a right triangular prism and a right cylinder are congruent. the right triangular prism has a height of 6 units, and the right cylinder has a height of 6 units. which conclusion can be made from the given information? the volume of the triangular prism is half the volume of the cylinder. the volume of the triangular prism is twice the volume of the cylinder. the volume of the triangular prism is equal to the volume of the cylinder. the volume of the triangular prism is not equal to the volume of the cylinder.
Answers: 1
Mathematics, 22.06.2019 04:20, Ahhskii
The weibull distribution is widely used in statistical problems relating to aging of solid insulating materials subjected to aging and stress. use this distribution as a model for time (in hours) to failure of solid insulating specimens subjected to ac voltage. the values of the parameters depend on the voltage and temperature; suppose α = 2.5 and β = 190. (a) what is the probability that a specimen's lifetime is at most 250? less than 250? more than 300? (round your answers to four decimal places.) at most 250 less than 250 more than 300 (b) what is the probability that a specimen's lifetime is between 100 and 250? (round your answer to four decimal places.) (c) what value is such that exactly 50% of all specimens have lifetimes exceeding that value? (round your answer to three decimal places.) hr
Answers: 2
Mathematics, 22.06.2019 05:00, jhenifelix
Mario and luigi were printing calendars mario used 2 1/2 ink cartridges while luigi used 1 3/4 ink cartridges .how many more ink cartridges did mario use than luigi
Answers: 1
Mathematics, 22.06.2019 05:20, iPlayOften3722
Ted and meg have each drawn a line on the scatter plot shown below: the graph shows numbers from 0 to 10 on x and y axes at increments of 1. dots are made at the ordered pairs 1, 8 and 2, 7.5 and 3, 6 and 4, 5.5 and 4.5, 4.8 and 5, 4 and 6, 3.5 and 7, 3 and 8, 1.9 and 9, 1.2 and 10, 0. a straight line labeled line p joins the ordered pairs 0, 8.5 and 10.1, 0. a straight line labeled line r joins the ordered pairs 0, 8.5 and 7.8, 0. which line best represents the line of best fit? line p, because it is closest to most data points line p, because it shows a positive association line r, because it is closest to most data points line r, because it shows a negative association
Answers: 1
You know the right answer?
Questions in other subjects:


Arts, 28.01.2021 22:40
Mathematics, 28.01.2021 22:40

History, 28.01.2021 22:40
Mathematics, 28.01.2021 22:40


