
Mathematics, 21.05.2021 21:00 julialombardo53
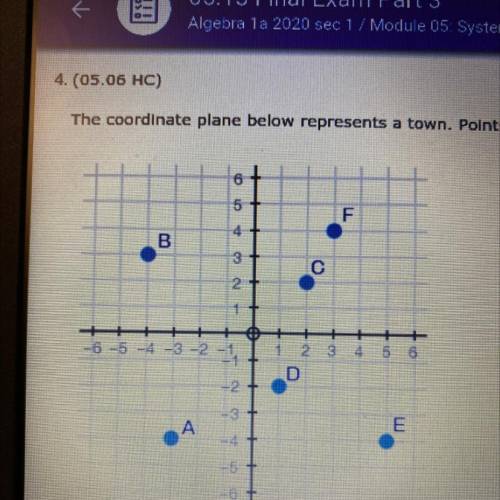
The coordinate plane below represents a town. Points A through F are farms in town.
Part A. Using the graph above create a system of inequalities that only contains points A in capital E in the overlapping shaded regions. Explain how the lines will be graphed and shaded on the coordinate grid above.
Part B. Explain how to verify that the points A and capital E are solutions to the system of inequalities created in part a.
Part C. Chickens can only be raised in the area defined by
y < -2x + 4. Explain how you can identify farms in which chickens can be raised.

Answers: 3


Other questions on the subject: Mathematics
Mathematics, 21.06.2019 17:30, fonsworth5
Kathy spent 5/8 of her money on books and another 1/6 of her money on stationeries. what fraction of kathy’s money was left?
Answers: 2
Mathematics, 22.06.2019 01:00, carolhubble
The balance of susu's savings account can be represented by the variable b. the inequality describing her balance b > $30 . which could be a solution to the inequality?
Answers: 2
You know the right answer?
The coordinate plane below represents a town. Points A through F are farms in town.
Part A. Using t...
Questions in other subjects:
Mathematics, 13.11.2020 17:20

Chemistry, 13.11.2020 17:20
Mathematics, 13.11.2020 17:20

Advanced Placement (AP), 13.11.2020 17:20
Advanced Placement (AP), 13.11.2020 17:20
Mathematics, 13.11.2020 17:20


