
Mathematics, 21.05.2021 18:20 davidsteck99
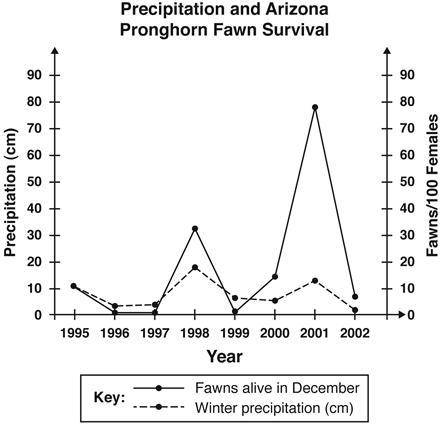
The graph below shows the winter precipitation in Arizona from 1995 to 2002. It also shows the survival rates of Arizona pronghorn fawns for the same period.
Which two years had the most precipitation?
• Which two years had the best survival rates for fawns?
• Using your knowledge of biotic and abiotic factors and information from the graph, give two reasons why precipitation and fawn population are linked.
• Predict what would happen to the fawn population if the precipitation rate continues to go downward in 2003.

Answers: 1


Other questions on the subject: Mathematics
Mathematics, 21.06.2019 16:30, jordivivar74
For how answer my question this will be the last question can you answer in math subject
Answers: 2
Mathematics, 21.06.2019 20:30, kuddlebugsmommy
Martha has a deck of cards. she has lost some of the cards, and now the deck only contains nine spades, eleven diamonds, eight clubs, and twelve hearts. martha predicts that whenever she draws a card from the deck without looking, she will draw a club one-fifth of the time. which activity would best allow martha to test her prediction? a. randomly draw a card from the box and see if it is a club. b. randomly draw a card. then, continue to draw another card until all eight clubs are drawn. c. randomly draw and replace a card 120 times. then, observe how close to 30 times a club is drawn. d. randomly draw and replace a card 100 times. then, observe how close to 20 times a club is drawn.
Answers: 1
Mathematics, 21.06.2019 21:30, celeste961
Write 5(6x+4)-2(5x-2) in the form a(bx+c) where a, b and c integers and a> 1
Answers: 2
You know the right answer?
The graph below shows the winter precipitation in Arizona from 1995 to 2002. It also shows the survi...
Questions in other subjects:
Mathematics, 24.02.2021 01:40

Mathematics, 24.02.2021 01:40


Physics, 24.02.2021 01:40

Geography, 24.02.2021 01:50
Mathematics, 24.02.2021 01:50


