
Mathematics, 21.05.2021 16:30 EthanIsHyper
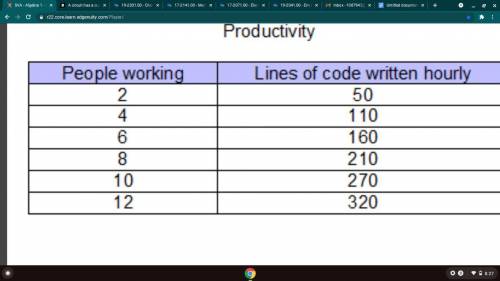
The table shows the estimated number of lines of code written by computer programmers per hour when x people are working.
Which model best represents the data?
y = 47(1.191)x
y = 34(1.204)x
y = 26.9x – 1.3
y = 27x – 4

Answers: 2


Other questions on the subject: Mathematics
Mathematics, 21.06.2019 13:20, MichaelBoolin87241
Figure abcd is a parallelogram. if point c lies on the line x = 2, what is the y-value of point c
Answers: 2
Mathematics, 21.06.2019 15:20, queentynaisa
Which is the equation of an ellipse with directrices at x = ±4 and foci at (2, 0) and (−2, 0)?
Answers: 3
You know the right answer?
The table shows the estimated number of lines of code written by computer programmers per hour when...
Questions in other subjects:


Chemistry, 10.07.2019 07:00

Mathematics, 10.07.2019 07:00


Health, 10.07.2019 07:00
Biology, 10.07.2019 07:00


