
Mathematics, 21.05.2021 02:40 gbprulesmile
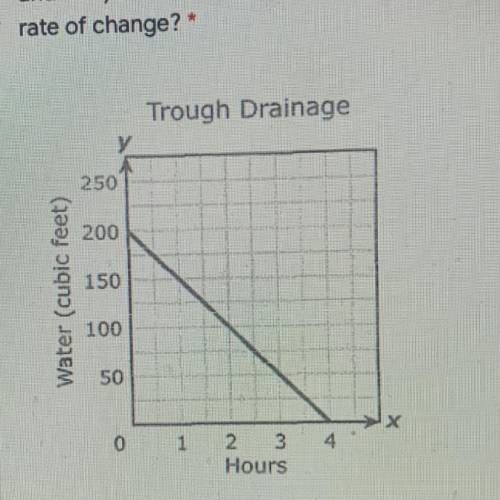
4. The graph below models the drainage. The x-axis is the time in hours,
and the y-axis is the cubic feet of water in the trough(pipe).
What is the
rate of change?"
a) -50
b) 50
c) -200
d) 200

Answers: 3


Other questions on the subject: Mathematics
Mathematics, 21.06.2019 23:00, lilque6112
The table below shows the function f. determine the value of f(3) that will lead to an average rate of change of 19 over the interval [3, 5]. a. 32 b. -32 c. 25 d. -25
Answers: 2
Mathematics, 22.06.2019 02:00, macinnoodlezz
What are linear equations? could'ya explain too me, ? ! and how do you see what graph is a proportional relationship?
Answers: 2
Mathematics, 22.06.2019 02:30, avagymnast421
Kate is arranging new furniture in her rectangular sitting room. she has mapped the arrangement on a coordinate pane. a, b and c represent the sofas, v1 and v2 are decorative vases and aq the aquarium. find the distance between v1 and the aquarium. any body you
Answers: 3
You know the right answer?
4. The graph below models the drainage. The x-axis is the time in hours,
and the y-axis is the cubi...
Questions in other subjects:
Mathematics, 28.06.2019 13:00

Physics, 28.06.2019 13:00


Chemistry, 28.06.2019 13:00

Biology, 28.06.2019 13:00


