Minimum Wage
NO
Minimum wage (dollars per hour)
ONUS
04
0 10 20 30 40 50 6...

Mathematics, 20.05.2021 20:50 shadowblade8203
Minimum Wage
NO
Minimum wage (dollars per hour)
ONUS
04
0 10 20 30 40 50 60 70 80
Years since 1940
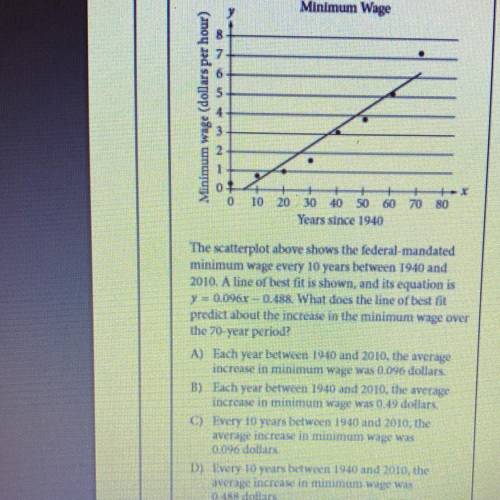
The scatterplot above shows the federal-mandated
minimum wage every 10 years between 1940 and
2010. A line of best fit is shown, and its equation is
y = 0.096x -0.488. What does the line of best fit
predict about the increase in the minimum wage over
the 70-year period?
A) Each year between 1940 and 2010, the average
increase in minimum wage was 0.096 dollars.
B) Each year between 1940 and 2010, the average
increase in minimum wage was 0.49 dollars
C) Every 10 years between 1940 and 2010, the
average increase in minimum wage was
0.096 dollars
D) Every 10 years between 1940 and 2010, the
average increase in minimum wage was
0.488 dollars

Answers: 3


Other questions on the subject: Mathematics
Mathematics, 21.06.2019 17:00, JvGaming2001
Scarlet bought three pairs of sunglasses and two shirts for $81 and paula bought one pair of sunglasses and five shirts for $105 what is the cost of one pair of sunglasses and one shirt?
Answers: 2
Mathematics, 21.06.2019 17:00, datgamer13
Why did the ice arena get so hot after the big game (this is math related google it to find the paper
Answers: 2
You know the right answer?
Questions in other subjects:
Mathematics, 27.01.2021 23:00


English, 27.01.2021 23:00


Mathematics, 27.01.2021 23:00


