The graph shows the relationship between
the volume of coffee in a cup and the length
of time...

Mathematics, 20.05.2021 19:40 katelynwest1
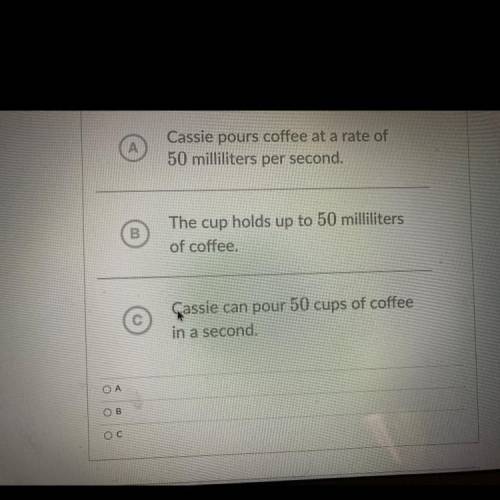
The graph shows the relationship between
the volume of coffee in a cup and the length
of time Cassie pours coffee into the cup.
milliliters
200
150
100
50+
(1,50)
seconds
1
2
3
What does 50 mean in this situation?

Answers: 1


Other questions on the subject: Mathematics
Mathematics, 21.06.2019 16:30, macenzie26
What could explain what happened when the time was equal to 120 minutes
Answers: 2
Mathematics, 21.06.2019 20:00, GreatBaconGamer
Solve for x and y a x= 13.3 y= 16.7 b x= 23.3 y= 12.5 c x= 7.5 y= 16.7 d x=7.5 y= 12.5
Answers: 1
Mathematics, 21.06.2019 20:30, cld3331
Merrida uses a pattern in the multiplication table below to find ratios that are equivalent to 7: 9. if merrida multiplies the first term, 7, by a factor of 6, what should she do to find the other term for the equivalent ratio? multiply 9 by 1. multiply 9 by 6. multiply 9 by 7. multiply 9 by 9.
Answers: 1
Mathematics, 21.06.2019 21:30, swordnewsnetwork
Which of the following disjunctions is true? 4 + 4 = 16 or 6 - 5 = 11 4 · 3 = 7 or 3 - 2 = 5 8 - 5 = 13 or 7 · 2 = 12 7 - 4 = 11 or 6 + 3 = 9
Answers: 1
You know the right answer?
Questions in other subjects:


Social Studies, 26.08.2020 14:01

English, 26.08.2020 14:01
English, 26.08.2020 14:01


