
Mathematics, 20.05.2021 18:20 coreen9
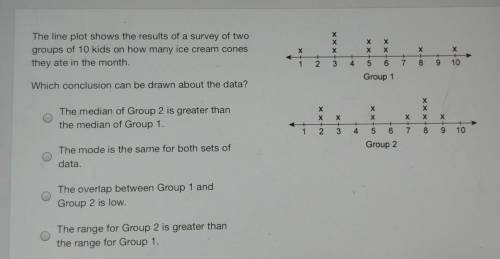
х The line plot shows the results of a survey of two groups of 10 kids on how many ice cream cones they ate in the month. х Х х Х х Х Х 1 2 3 4 5 6 7 8 9 10 Group 1 Which conclusion can be drawn about the data? The median of Group 2 is greater than the median of Group 1. Х Х х Х X X х X + 5 Х + 3 х + 7 2 4 6 8 9 10 The mode is the same for both sets of Group 2 data. The overlap between Group 1 and Group 2 is low. The range for Group 2 is greater than the range for Group 1.

Answers: 1


Other questions on the subject: Mathematics
Mathematics, 21.06.2019 20:30, richchillnqueenz1ma
Write an equation of the line that passes through 9,2 and is parallel to the line y=5/3x+9
Answers: 1
Mathematics, 21.06.2019 22:30, 20alondra04
Explain how you could use the interactive table to tell if sets of points are on the same line. math 8
Answers: 2
Mathematics, 22.06.2019 01:50, vorhees2406
If jklm is a trapezoid, which statements must be true?
Answers: 1
You know the right answer?
х The line plot shows the results of a survey of two groups of 10 kids on how many ice cream cones t...
Questions in other subjects:


Spanish, 24.08.2021 02:40


