
Mathematics, 20.05.2021 16:30 dmccarthey90
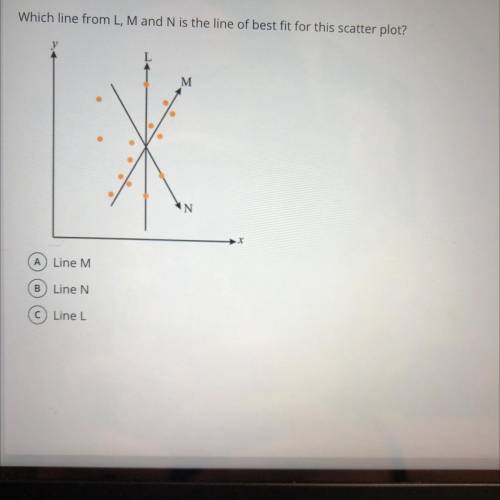
Which line from L, M and N is the line of best fit for this scatter plot? can you explain to me why it’s that answer

Answers: 1


Other questions on the subject: Mathematics
Mathematics, 21.06.2019 19:30, ndurairajownkpq
The cone in the diagram has the same height and base area as the prism. what is the ratio of the volume of the cone to the volume of the prism? h hl base area-b base area =b volume of cone_1 volume of prism 2 volume of cone 1 volume of prism 3 volume of cone 2 volume of prism 3 oc. od. volume of cone volume of prism e. volume of cone volume of prism 3 2
Answers: 3
Mathematics, 21.06.2019 20:20, shartman22
20 solve 2(4 x + 3) < 5 x + 21. a) { x | x < 9} b) { x | x > -5} c) { x | x > -9} d) { x | x < 5}
Answers: 2
Mathematics, 21.06.2019 20:30, helpmepls23
Steve had 48 chocolates but he decided to give 8 chocolats to each of his f coworkers. how many chocolates does steve have left
Answers: 1
Mathematics, 21.06.2019 23:00, sandyrose3012
Multiplying fractions by whole number 5 x 1/3=?
Answers: 2
You know the right answer?
Which line from L, M and N is the line of best fit for this scatter plot?
can you explain to me why...
Questions in other subjects:

History, 21.04.2021 22:50
Mathematics, 21.04.2021 22:50
Mathematics, 21.04.2021 22:50

Mathematics, 21.04.2021 22:50
History, 21.04.2021 22:50

Social Studies, 21.04.2021 22:50


