
Mathematics, 20.05.2021 14:00 BaileyElizabethRay
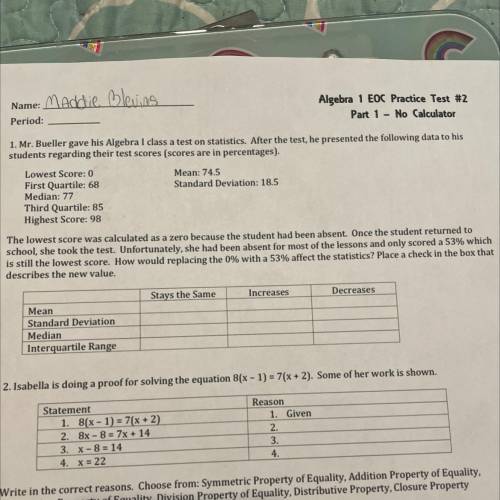
1. Mr. Bueller gave his Algebra I class a test on statistics. After the test, he presented the following data to his
students regarding their test scores (scores are in percentages).
Mean: 74.5
Standard Deviation: 18.5
Lowest Score: 0
First Quartile: 68
Median: 77
Third Quartile: 85
Highest Score: 98
The lowest score was calculated as a zero because the student had been absent. Once the student returned to
school, she took the test. Unfortunately, she had been absent for most of the lessons and only scored a 53% which
is still the lowest score. How would replacing the 0% with a 53% affect the statistics? Place a check in the box that
describes the new value.
Stays the Same
Increases
Decreases
Mean
Standard Deviation
Median
Interquartile Range

Answers: 3


Other questions on the subject: Mathematics
Mathematics, 21.06.2019 13:30, khenalilovespandas
Which point is a solution to the inequality shown in this graph (-3,-3)(3,-1)
Answers: 2
Mathematics, 21.06.2019 21:00, gabrielar80
The paint recipe also calls for 1/4 cup of food coloring. tyler says mrs. mcglashan will also need 6 cups of food coloring. do u agree or disagree? explain.
Answers: 2
Mathematics, 22.06.2019 00:10, iwannabewinston
Which of the following expressions cannot be simplified to x – 2?
Answers: 1
You know the right answer?
1. Mr. Bueller gave his Algebra I class a test on statistics. After the test, he presented the follo...
Questions in other subjects:

History, 24.06.2019 14:30

Mathematics, 24.06.2019 14:30


Mathematics, 24.06.2019 14:30
Mathematics, 24.06.2019 14:30
Mathematics, 24.06.2019 14:30


