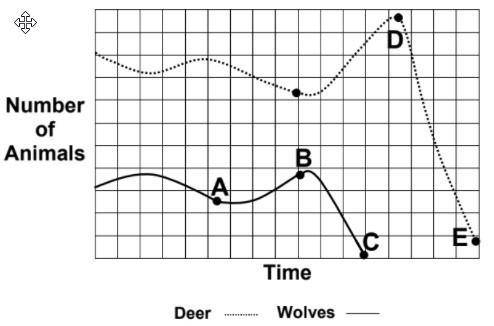
1. What could have happened to Wolf population on the point B?
Question 1 options:
Ther...

Mathematics, 19.05.2021 23:40 aidenbender06
1. What could have happened to Wolf population on the point B?
Question 1 options:
There was large number of hunting licenses given and Wolf population decreased.
There were a lot of food available, so the population increased.
There were no deer left to eat, so the Wolf population decreased.
There were increase on population due to high number of births.
2. Which is the best explanation why the population of Deer started decline on point D?
Question 2 options:
The change in Wolf population did not have any effect on Deer population, there must have been a natural disaster that caused all deer to die in the area and then there were no deer nor wolf left.
They moved to other area, because there were no predators and they need them to form a mutualistic relationship.
After most of the Wolf died, there were too many deer and not enough food, so their numbers declined just a little bit.
When deer loosed its natural predator, their numbers became too large to be sustained and many of them died on starvation and others died in disease and numbers declined a lot.

Answers: 3


Other questions on the subject: Mathematics
Mathematics, 21.06.2019 13:00, QueenNerdy889
You download a video game to your computer. you have a 60-minute free trial of the game. it takes 5 1/6 minutes to set up the game 7 1/3 minutes to play each level. you want to find out how many levels you can play for free. which inequality describes the number of levels, l, you can play in 60 minutes? can you play 6 levels during your free trial? i need ,
Answers: 3
Mathematics, 21.06.2019 19:30, bxbykyah
You have learned about the six trigonometric functions, their definitions, how to use them, and how to represent them graphically. the sine, cosine, and tangent trigonometric functions can be paired with their reciprocal functions, cosecant, secant, and cotangent, respectively. think about how each function is related to its reciprocal function. how are the graphs of the reciprocal functions related to their corresponding original functions? what happens to the graphs of the reciprocal functions as x approaches the zeros of the original functions? describe how you would teach friends with different learning styles (visual-spatial, aural-auditory, verbal-linguistic, physical-bodily-kinesthetic, logical-mathematical, social-interpersonal, and solitary-intrapersonal) how to graph the reciprocal functions
Answers: 2
You know the right answer?
Questions in other subjects:
Mathematics, 01.02.2021 03:30
Mathematics, 01.02.2021 03:30

History, 01.02.2021 03:30
Mathematics, 01.02.2021 03:30
Mathematics, 01.02.2021 03:30

English, 01.02.2021 03:30


