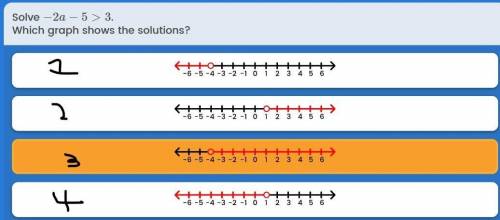
Solve -2a -5 >3
which graph shows the solutions?
...

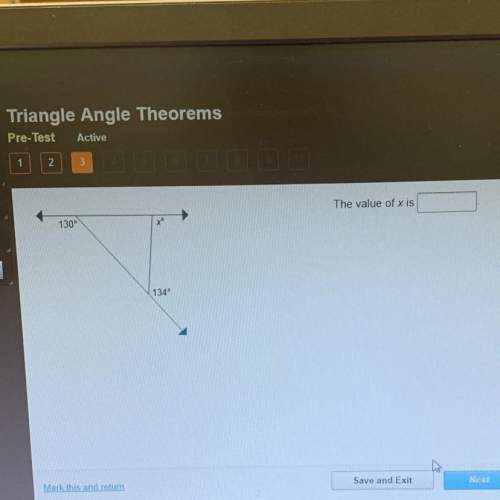
Mathematics, 19.05.2021 23:30 kierafisher05
Solve -2a -5 >3
which graph shows the solutions?

Answers: 1


Other questions on the subject: Mathematics
Mathematics, 21.06.2019 13:00, phamleson8697
Solve for x i'll try to attach the files bc it's not letting me for some reason
Answers: 1
Mathematics, 21.06.2019 19:40, evarod
Afactory makes propeller drive shafts for ships. a quality assurance engineer at the factory needs to estimate the true mean length of the shafts. she randomly selects four drive shafts made at the factory, measures their lengths, and finds their sample mean to be 1000 mm. the lengths are known to follow a normal distribution whose standard deviation is 2 mm. calculate a 95% confidence interval for the true mean length of the shafts. input your answers for the margin of error, lower bound, and upper bound.
Answers: 3
Mathematics, 21.06.2019 22:00, yay47
Worth 100 points need the answers asap first row -x^2 2x^2 (x/2)^2 x^2 x is less than 2 x is greater than 2 x is less than or equal to 2 x is greater than or equal to 2 second row -5 -5/2 4 5 •2 is less than x& x is less than 4 •2 is less than or equal to x & x is less than or equal to 4 •2 is less than or equal to x& x is less than 4 •2 is less than x& x is less than or equal to 4
Answers: 1
You know the right answer?
Questions in other subjects:

Chemistry, 11.07.2019 02:30

Chemistry, 11.07.2019 02:30


