
Mathematics, 19.05.2021 23:10 genyjoannerubiera
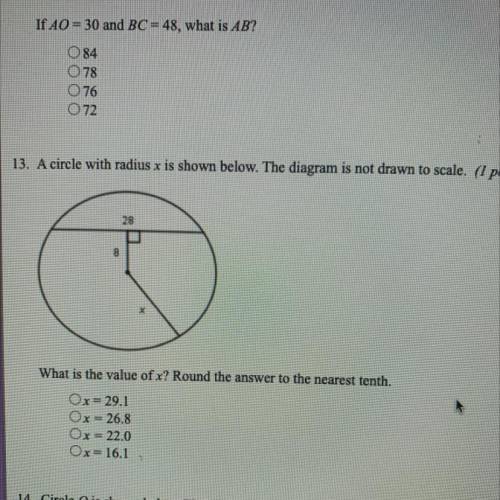
13. A circle with radius x is shown below. The diagram is not drawn to scale.
What is the value of x? Round the answer to the nearest tenth.
Ox=29.1
Ox = 26.8
Ox = 22.0
Ox= 16.1

Answers: 2


Other questions on the subject: Mathematics
Mathematics, 21.06.2019 17:30, Vampfox
Monthly water bills for a city have a mean of $108.43 and a standard deviation of $32.09. find the probability that a randomly selected bill will have an amount greater than $155, which the city believes might indicate that someone is wasting water. would a bill that size be considered unusual?
Answers: 1
Mathematics, 22.06.2019 02:30, reneewilliams20
Alex buys a home for $276,400. his home is predicted to increase in value 3.5% each year. what is the predicted value of alex’s home in 25 years? a. 621,357 b. 635,191 c. 653,201 d. 673,415
Answers: 1
Mathematics, 22.06.2019 04:30, ashton3952525
The survey of study habits and attitudes (ssha) is a psychological test that measures the motivation, attitude toward school, and study habits of students, scores range from 0 to 200. the mean score for u. s. college students is about 115, and the standard deviation is about 30. a teacher who suspects that older students have better attitudes toward school gives the ssha to 55 students who are at least 30 years of age. the mean score is 113.2. assume the population standard deviation is 30 for older students what is the margin of error for a 95% confidence interval for the population mean score for a. older students? b. compute the 95% confidence interval for the population mean score for older students. c. compute the 99% confidence interval for the population mean score for older students. d. compute the 88% confidence interval for the population mean score for older students.
Answers: 3
You know the right answer?
13. A circle with radius x is shown below. The diagram is not drawn to scale.
What is the value of...
Questions in other subjects:
Mathematics, 13.02.2020 07:23

Mathematics, 13.02.2020 07:23

Mathematics, 13.02.2020 07:24

Mathematics, 13.02.2020 07:24
Mathematics, 13.02.2020 07:25


