
Mathematics, 19.05.2021 17:40 heyrosaphoto2610
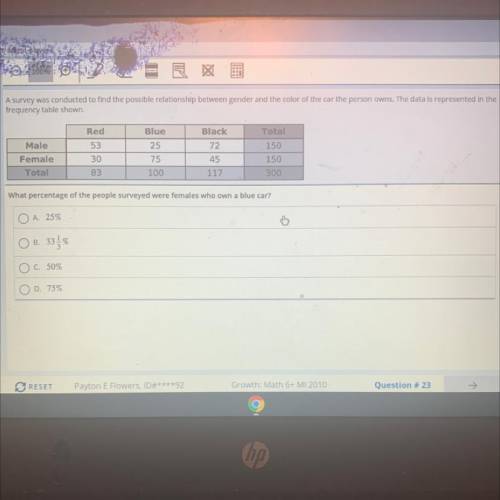
A survey was conducted to find the possible relationship between gender and the color of the car the person owns. The data is represented in the
frequency table shown.
Blue
Total
Red
53
Male
Female
Total
25
75
Black
72
45
117
30
83
150
150
300
100
What percentage of the people surveyed were females who own a blue car?

Answers: 2


Other questions on the subject: Mathematics
Mathematics, 21.06.2019 21:50, roxanneee2145
5. which description does not guarantee that a quadrilateral is a squar ajo is a parallelogram with perpendicular diagonals 0% has all sides congruent and all angles congruent o has all right angles and has all sides congruent 10% is both a rectangle and a rhombus 30%
Answers: 2
Mathematics, 21.06.2019 22:10, cheryljoseph69
Asix-sided number cube is rolled twice. what is the probability that the first roll is an even numbe and the second roll is a number greater than 4?
Answers: 1
You know the right answer?
A survey was conducted to find the possible relationship between gender and the color of the car the...
Questions in other subjects:


Chemistry, 08.01.2021 18:40
Mathematics, 08.01.2021 18:40
Mathematics, 08.01.2021 18:40

History, 08.01.2021 18:40


Social Studies, 08.01.2021 18:40


