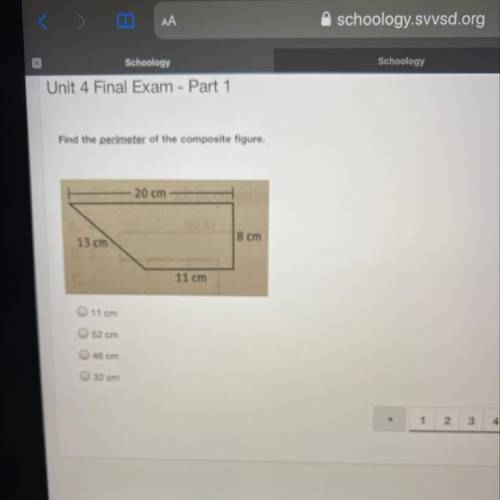
HELP ASAP
I need someone to help please I need to make my mom proud
...

Mathematics, 19.05.2021 04:00 zakeiryh
HELP ASAP
I need someone to help please I need to make my mom proud


Answers: 3


Other questions on the subject: Mathematics


Mathematics, 21.06.2019 22:00, Jasten
Set $r$ is a set of rectangles such that (1) only the grid points shown here are used as vertices, (2) all sides are vertical or horizontal and (3) no two rectangles in the set are congruent. if $r$ contains the maximum possible number of rectangles given these conditions, what fraction of the rectangles in set $r$ are squares? express your answer as a common fraction.
Answers: 1

Mathematics, 21.06.2019 23:00, kj44
Each of the following data sets has a mean of x = 10. (i) 8 9 10 11 12 (ii) 7 9 10 11 13 (iii) 7 8 10 12 13 (a) without doing any computations, order the data sets according to increasing value of standard deviations. (i), (iii), (ii) (ii), (i), (iii) (iii), (i), (ii) (iii), (ii), (i) (i), (ii), (iii) (ii), (iii), (i) (b) why do you expect the difference in standard deviations between data sets (i) and (ii) to be greater than the difference in standard deviations between data sets (ii) and (iii)? hint: consider how much the data in the respective sets differ from the mean. the data change between data sets (i) and (ii) increased the squared difference îł(x - x)2 by more than data sets (ii) and (iii). the data change between data sets (ii) and (iii) increased the squared difference îł(x - x)2 by more than data sets (i) and (ii). the data change between data sets (i) and (ii) decreased the squared difference îł(x - x)2 by more than data sets (ii) and (iii). none of the above
Answers: 2

Mathematics, 22.06.2019 00:30, trujillo03
1.3.25 question suppose 40​% of all voters voted for a particular candidate. to simulate exit polls regarding whether or not voters voted for this​ candidate, five random samples of size 1010 and five random samples of size 10001000 have been generated using technology using a population proportion of 0.400.40​, with the accompanying results. complete parts a through c below. click the icon to view the simulation results. a. observe how the sample proportions of successes vary around 0.400.40. simulation compared to sample prop simulation compared to sample prop 1 ▾ 6 ▾ greater than 0.40 less than 0.40 equal to 0.40 2 ▾ less than 0.40 greater than 0.40 equal to 0.40 7 ▾ greater than 0.40 less than 0.40 equal to 0.40 3 ▾ greater than 0.40 less than 0.40 equal to 0.40 8 ▾ equal to 0.40 greater than 0.40 less than 0.40 4 ▾ greater than 0.40 equal to 0.40 less than 0.40 9 ▾ less than 0.40 greater than 0.40 equal to 0.40 5 ▾ equal to 0.40 less than 0.40 greater than 0.40 10 ▾ equal to 0.40 greater than 0.40 less than 0.40 click to select your answer(s) and then click check answer. 2 parts remaining clear all check answer
Answers: 3
You know the right answer?
Questions in other subjects:


English, 12.03.2022 08:00


Physics, 12.03.2022 08:00


Mathematics, 12.03.2022 08:00


Physics, 12.03.2022 08:00

English, 12.03.2022 08:00

Mathematics, 12.03.2022 08:10


