
Mathematics, 19.05.2021 02:20 sandrafina2004
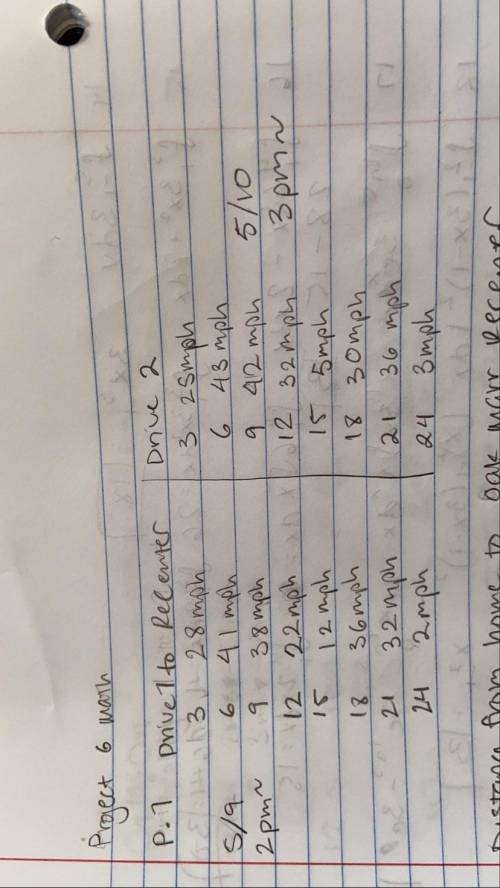
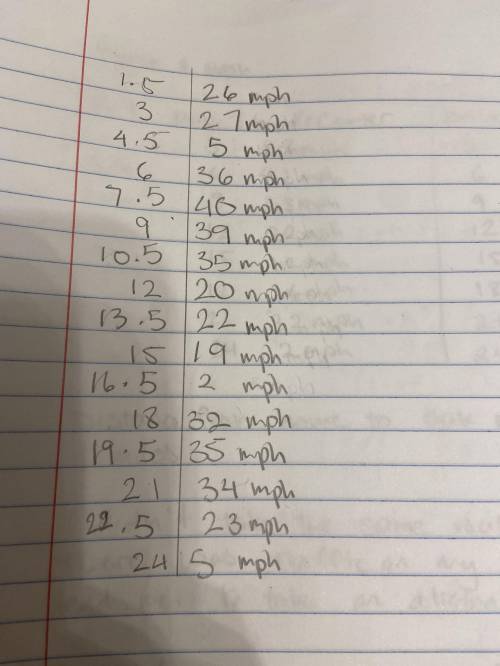
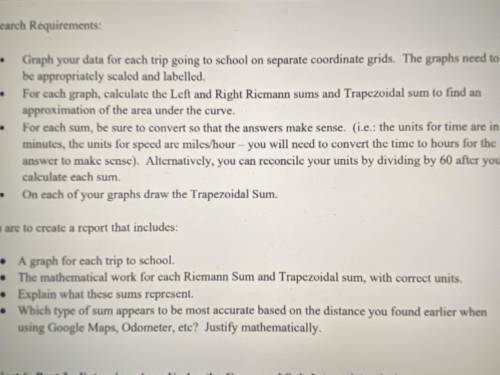
Graph your data for each trip going to school on separate coordinate grids. The graphs need to be appropriately scaled and labelled. For each graph, calculate the Left and Right Riemann sums and Trapezoidal sum to find an approximation of the area under the curve. For each sum, be sure to convert so the answers make sense. On each of your graphs draw the trapezoidal sum. Data are included in the files below! I will award 50 points! Please answer by today!

Answers: 2


Other questions on the subject: Mathematics
Mathematics, 21.06.2019 15:00, denisebaslee15
Of four points are collinear, they are also coplanar
Answers: 2
Mathematics, 21.06.2019 18:30, starlightmoon213
The measure of one angle of an octagon is two times smaller that of the other seven angles. what is the measure of each angle?
Answers: 3
Mathematics, 21.06.2019 20:30, natebarr17
The interior angles formed by the side of a hexagon have measures of them up to 720° what is the measure of angle a
Answers: 2
You know the right answer?
Graph your data for each trip going to school on separate coordinate grids. The graphs need to be ap...
Questions in other subjects:

Chemistry, 06.04.2021 21:50


