
Mathematics, 18.05.2021 19:30 mollymay125
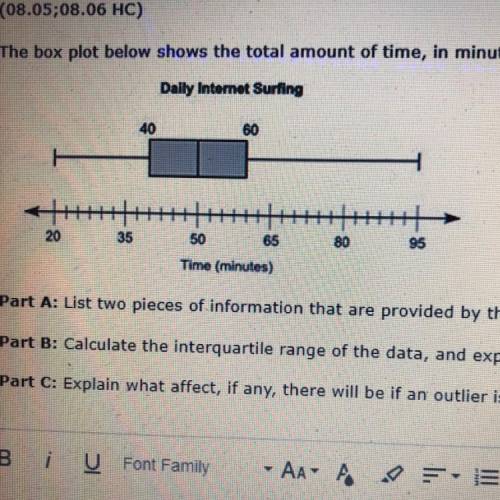
The box plot below shows the total amount of time, in minutes, the students of a class surf the Internet every day:
Part A: List two pieces of information that are provided by the graph and one piece of information that is not provided by the graph.
Part B: Calculate the interquartile range of the data, and explain in a sentence or two what it represents.
Part C: Explain what affect, if any, there will be if an outlier is present.

Answers: 2


Other questions on the subject: Mathematics
Mathematics, 21.06.2019 16:00, choyontareq
The step function g(x) is defined as shown. what is the range of g(x)? ***answer choices in picture.
Answers: 3
Mathematics, 21.06.2019 18:30, Angelanova69134
Someone answer this asap rn for ! a discount store’s prices are 25% lower than department store prices. the function c(x) = 0.75x can be used to determine the cost c, in dollars, of an item, where x is the department store price, in dollars. if the item has not sold in one month, the discount store takes an additional 20% off the discounted price and an additional $5 off the total purchase. the function d(y) = 0.80y - 5 can be used to find d, the cost, in dollars, of an item that has not been sold for a month, where y is the discount store price, in dollars. create a function d(c(x)) that represents the final price of an item when a costumer buys an item that has been in the discount store for a month. d(c(x)) =
Answers: 1
You know the right answer?
The box plot below shows the total amount of time, in minutes, the students of a class surf the Inte...
Questions in other subjects:


Physics, 09.09.2020 22:01
Mathematics, 09.09.2020 22:01

English, 09.09.2020 22:01


Social Studies, 09.09.2020 22:01

Computers and Technology, 09.09.2020 22:01

Advanced Placement (AP), 09.09.2020 22:01


