Mathematics, 18.05.2021 18:50 NicolasG
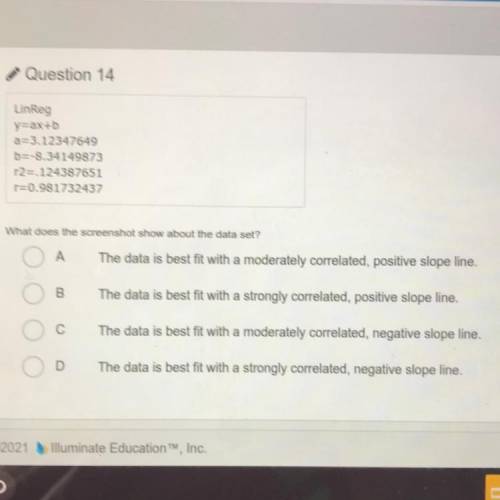
LinReg
y=ax+b
a=3.12347649
b=-8.34149873
r2= 124387651
r=0.981732437
What does the screenshot show about the data set?
A
The data is best
with a moderately correlated, positive slope line.
B
The data is best
with a strongly correlated, positive slope line.
С
The data is best
with a moderately correlated, negative slope line.
D
The data is best fit with a strongly correlated, negative slope line.


Answers: 1


Other questions on the subject: Mathematics

Mathematics, 21.06.2019 14:30, purpletart41
Arrange these numbers from least to greatest 3/5 5/7 2/9
Answers: 2


Mathematics, 22.06.2019 01:00, mleighaj9560
38 points and brainliest plz answer question in word document
Answers: 1
You know the right answer?
LinReg
y=ax+b
a=3.12347649
b=-8.34149873
r2= 124387651
r=0.981732437
...
a=3.12347649
b=-8.34149873
r2= 124387651
r=0.981732437
...
Questions in other subjects:


Mathematics, 31.03.2020 17:31


Social Studies, 31.03.2020 17:31


Mathematics, 31.03.2020 17:31

Biology, 31.03.2020 17:31

Mathematics, 31.03.2020 17:31


English, 31.03.2020 17:31


