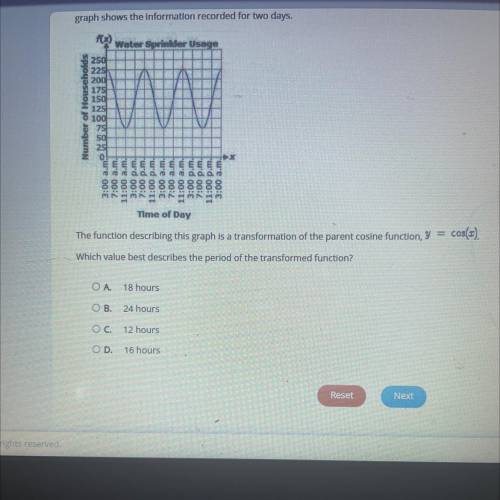
Graph shows the information recorded for two days.
FOXO
Water Sprinkler Usage
Number of...

Mathematics, 18.05.2021 03:20 hannah2718
Graph shows the information recorded for two days.
FOXO
Water Sprinkler Usage
Number of Households
250
225
200
175
150
125
8 100
75
e 50
25
0
EE
fororo
11:00 a. m.
3:00 p. m.
7:00 p. m.
11:00 p. m.
3:00 a. m.
7:00 a. m.
11:00 a. m.
3:00 p. m.
7:00 p. m.
11:00 p. m.
3:00 a. m.
Cost).
Time of Day
The function describing this graph is a transformation of the parent cosine function, y =
Which value best describes the period of the transformed function?
OA 18 hours
OB. 24 hours
OC. 12 hours
OD. 16 hours

Answers: 3


Other questions on the subject: Mathematics
Mathematics, 21.06.2019 22:50, tali2561
Aclassroom is made up of 11 boys and 14 girls. the teacher has four main classroom responsibilities that she wants to hand out to four different students (one for each of the four students). if the teacher chooses 4 of the students at random, then what is the probability that the four students chosen to complete the responsibilities will be all boys?
Answers: 1
Mathematics, 22.06.2019 01:30, hela9astrid
This graph shows a portion of an odd function. use the graph to complete the table of values. x f(x) −2 −3 −4 −6 im sorry i cant get the graph up
Answers: 1
You know the right answer?
Questions in other subjects:
Mathematics, 10.07.2019 00:30

Mathematics, 10.07.2019 00:30


World Languages, 10.07.2019 00:30
History, 10.07.2019 00:30
Mathematics, 10.07.2019 00:30


