
Mathematics, 17.05.2021 16:20 721345
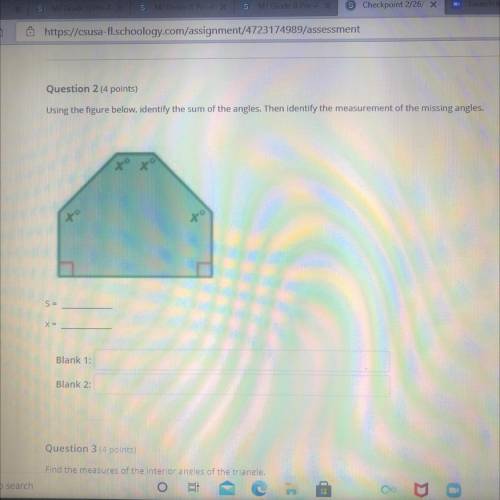
Using the figure below, identify the sum of the angles. Then identify the measurement of the missing angles
S=
Blank 1:
Blank 2

Answers: 2


Other questions on the subject: Mathematics
Mathematics, 21.06.2019 14:10, uhhgray
Students are given 3 minutes for each multiple-choice question and 5 minutes for each free-response question on a test. there are 15 questions on the test, and students are given 51 minutes to take it. how many multiple-choice questions are on the test?
Answers: 1
Mathematics, 21.06.2019 17:10, ivilkas23
The frequency table shows a set of data collected by a doctor for adult patients who were diagnosed with a strain of influenza. patients with influenza age range number of sick patients 25 to 29 30 to 34 35 to 39 40 to 45 which dot plot could represent the same data as the frequency table? patients with flu
Answers: 2
Mathematics, 21.06.2019 21:20, madisontrosclair2
Amajor grocery store chain is trying to cut down on waste. currently, they get peaches from two different distributors, whole fruits and green grocer. out of a two large shipments, the manager randomly selects items from both suppliers and counts the number of items that are not sell-able due to bruising, disease or other problems. she then makes a confidence interval. is there a significant difference in the quality of the peaches between the two distributors? 95% ci for pw-pg: (0.064, 0.156)
Answers: 3
You know the right answer?
Using the figure below, identify the sum of the angles. Then identify the measurement of the missing...
Questions in other subjects:
Mathematics, 11.09.2020 06:01
Mathematics, 11.09.2020 06:01
Mathematics, 11.09.2020 06:01

History, 11.09.2020 06:01
Mathematics, 11.09.2020 06:01
History, 11.09.2020 06:01

World Languages, 11.09.2020 06:01
Mathematics, 11.09.2020 06:01
Mathematics, 11.09.2020 06:01
Mathematics, 11.09.2020 06:01


